

National GHG inventories are a key part of a national MRV system. Under the Paris Agreement, inventories will be required on at least a biennial basis and will underpin countries’ reporting on their Nationally Determined Contributions (NDCs). Many countries are seeking to link MRV of specific mitigation actions with national GHG inventories in order to measure and report on progress in relation to NDCs.
When it come to measuring mitigation in the livestock sector, the methodological approach used for measuring GHG emissions determines the utility of a GHG inventory for MRV of mitigation actions. Tier 1 approaches assume fixed emissions per animal, so they do not reflect changes in animal production and productivity. In contrast, Tier 2 or Tier 3 methods use information on the animal’s gross energy or dry matter intake to estimate their actual emissions. These methods reflect country’s actual farming systems and their productivity, and automatically pick up any changes over time.
Given the need for Tier 2 or Tier 3 inventories to demonstrate mitigation, the following guidance aims to help users plan Tier 2 inventories for livestock.
Technical dimensions of structuring a Tier 2 inventory
This section highlights factors that are considered in decisions about:
- which livestock types to apply a Tier 2 approach to;
- how livestock is characterized in Tier 2 approaches;
- how Tier 2 approaches are linked with methods for estimating manure management emissions; and
- how the availability of data, information and other knowledge resources in the livestock sector may influence the choice of technical approach to inventory compilation.
Key category analysis and choice of tiered approach
Identification of key categories in a national inventory enables limited resources to be targeted to the improvement in data and methods for inventory categories that have significant effects on total absolute emissions, the trend in emissions, or both. IPCC guidance recommends that higher tier methods should be used for key categories. Analysis of 140 livestock inventories from developing countries has found that less than half reported having conducted key category analysis (Wilkes et al. 2017). For many countries, therefore, conducting key category analysis would help in identifying the emission sources to prioritize for targeting of limited available resources.
The IPCC guidelines set out in detail procedures for identification of key categories in the national inventory (IPCC GPG 2000, IPCC 2006 Vol 1, Ch 4). The guidelines set out two approaches to key category analysis:
- Approach 1 level assessment: Key categories are those that, when summed together in descending order of magnitude, add up to 95 percent of the total level of emissions in the inventory.
- Approach 1 trend assessment: Key categories are those whose trend is different from the trend in total emissions, weighted by the level of emissions or removals in the base year.
- Approach 2: The Approach 1 level and trend assessment results are weighted by the percentage uncertainty of each emission category, and key categories are those that add up to 90% of the total sum of uncertainty-weighted emissions in a given year, or 90% of the total sum of the uncertainty-weighted trend in emissions.
For livestock, IPCC (2006) recommends that key category analysis should be applied to the main livestock emission categories (e.g., enteric fermentation, manure management), and if these categories are identified as key, it should then be determined which animal species are significant contributors to these emissions. Emissions from these species should then be estimated using higher tier approaches, where possible (Figure 8). Other criteria mentioned in the IPCC guidance include using Tier 2 for enteric fermentation or manure management emissions:
- if the data used to develop the IPCC default values do not correspond well with the country’s conditions; or
- if the country has a large population of cattle, buffalo, or swine; or
- if emissions from a livestock type or sub-type are a large portion of total methane emissions for the country.
Figure 8: Decision tree for choice of methodological tier (IPCC 2006)
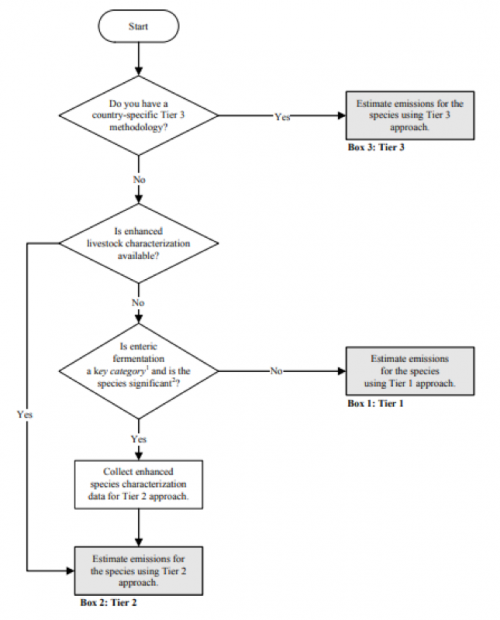
Source: IPCC 2006 vol 4 ch 10.
Reflecting the contribution of livestock to emission inventories and the prioritization of resources, among the 63 countries that use a Tier 2 approach for livestock emissions:
- one country applies a Tier 2 approach to dairy cattle only;
- 27 apply a Tier 2 approach to both dairy and other cattle types;
- 17 apply Tier 2 to cattle and one additional type of animal; and
- the remaining 18 countries use Tier 2 approaches for both types of cattle and two or more other species.
Many countries began by applying a Tier 2 approach to one type of livestock, and subsequently applied it to other livestock types over time.
For countries considering adopting Tier 2 approaches, in addition to the results of key category analysis, other factors that may be relevant to consider include:
Prioritization of limited resources: As shown in Chapter 3, many countries’ initial Tier 2 inventory uses a variety of data sources, including IPCC default data, expert judgement and data from other countries’ inventories or literature, so compiling an initial Tier 2 inventory need not require extensive primary data collection. However, selecting livestock types or sub-types for an initial Tier 2 approach can target the use of limited resources for national inventories, and provide experience that can later be applied to other livestock types. Key category analysis may identify a large number of inventory categories. The United Kingdom applies a ranking tool to help identify priority categories for improvement (Inventory practice: Prioritization of key categories in the United Kingdom’s inventory).
Alignment of national GHG inventory with livestock development and climate policy goals: Where countries intend to capture the effects of livestock development or GHG mitigation policies in their national GHG inventories, a Tier 2 approach will be needed. Inventory improvements can be targeted to those sub-sectors or regions where it is expected that policy interventions will affect the trend in emissions (Wilkes et al. 2017; Inventory Practice: Aligning national GHG inventories, NDCs and NAMAs in Kenya)
Livestock characterization
IPCC guidelines (2006) state that livestock population subcategories should be defined to create relatively homogenous sub-categories of animals that reflect country-specific variations in animal characteristics and feed within the overall livestock population. General guidance on representative livestock sub-categories is provided. For example, it is recommended to categorize cattle into a minimum of 3 sub-categories: mature dairy, other mature cattle and growing cattle. Suggestions on further sub-categories are also made (Table 3).
Table 3: Representative cattle sub-categories identified in the IPCC (2006) Guidelines
| Main categories | Subcategories |
|---|---|
| Mature dairy cow or mature dairy buffalo | • High-producing cows that have calved at least once and are used principally for milk production • Low-producing cows that have calved at least once and are used principally for milk production |
| Other mature cattle or mature non-dairy buffalo | Females: • Cows used to produce offspring for meat • Cows used for more than one production purpose (milk meat, draft) Males: • Bulls used principally for breeding purposes • Bullocks used principally for draft power |
| Growing cattle or growing buffalo | • Calves pre-weaning • Replacement dairy heifers • Growing fattening cattle • Feedlot-fed cattle on diets containing >90% concentrates |
Source: IPCC 2006 Vol. 4 Ch. 10
Livestock characterization is a critical step in the development of a Tier 2 approach. It determines how country-specific conditions are reflected in the inventory, and the level of disaggregation of activity data required for estimating GHG emissions. It thus determines the feasibility and complexity of inventory compilation. So how do countries categorize cattle in practice?
Dairy cattle: Countries categorize dairy cattle into between 1 and 156 subcategories, with an average of about 8 sub-categories. Among the 63 countries reviewed, 66% report only one category of dairy cattle (i.e. mature, female milking cows). In some cases, this reflects the definition of dairy cattle in national livestock statistics. In other cases, significant differences in management or animal performance within the country have been taken into consideration and further sub-categories of dairy cattle have been defined on the basis of geographic region (9 countries), production system (5 countries), breed (3 countries) or productivity (1 country). Where countries report only one category of dairy cow, replacement animals and other cattle in dairy production systems are reported in the ‘other cattle’ category (see Inventory Practice: Characterization of dairy cattle).
Other cattle: Countries categorize non-dairy cattle into between 1 and 416 sub-categories, with a modal number of 7 sub-categories (Table 4). Categorization based on age, sex or physiological status are most commonly used, but some countries also categorize based on the use of each animal category (e.g. slaughter animals, replacement heifers), geographical region, production system or breed. For example, Georgia has categorized cattle into two breeds to account for significant differences in performance between traditional late maturing breeds and more recently introduced early maturing breeds (see Inventory Practice: Livestock characterization and herd structure modeling in Georgia). In Austria, 18% of the farm area is now under organic production, and categorization of non-dairy cattle distinguishes between organic and conventional production systems to account for significant differences in feed types between these two production systems (see Country Case Study: Austria).
Table 4: Frequency of using different criteria to characterize sub-categories of non-dairy cattle
| Criterion | Age | Sex/physiological status | Breed | Production system | Use | Region |
|---|---|---|---|---|---|---|
| Frequency | 55 | 51 | 8 | 9 | 20 | 11 |
Data availability is one common determinant of the choice of livestock characterization approach. Revision of the inventory approach to make better use of available data is clearly shown in the inventory practice case studies describing livestock characterization in Uruguay and regionalization of the dairy cattle emissions inventory in New Zealand. New Zealand’s experience shows that regional categorization of livestock may not increase accuracy of the inventory in any given year, but if regional categorization enables better data to be used to characterize livestock sub-populations, it may improve the ability of the inventory to track changes in animal performance over time.
Where data on livestock sub-populations is missing, alternative data sources have also been used, such as:
- herd modeling used in Georgia to produce estimates of sub-populations of each type of breed included in the inventory (see Inventory Practice: Livestock characterization and herd structure modeling in Georgia);
- interpolation and trend extrapolation used to fill gaps in the time series of sub-populations (see Inventory practice: Dealing with missing data for livestock characterization in Austria).
Where data to characterize livestock management practices and performance for livestock sub-categories are missing, methods used include expert working groups (e.g. in Uruguay), regional workshops to elicit expert opinion (e.g. in Colombia) or structured expert judgement elicitation processes (see Inventory practice: Structured elicitation of expert judgement in Canada; Inventory practice: estimating digestible energy and methane conversion rates for feedlot cattle in the USA).
Enteric fermentation and manure management linkages
Following the IPCC Guidelines (2006), Tier 2 characterization of livestock sub-categories enables disaggregated estimation of feed intake for estimating enteric fermentation emissions. The same feed intake estimates should then be used for estimates of manure and nitrogen excretion rates in methane and nitrous oxide emissions from manure management. There are also links between the livestock characterization approach and estimation of manure management methane emissions, because the latter should be estimated in line with the distribution of climate regions within a country (IPCC 2006 Vol 4, Ch 10, 10.41).
In view of these interlinkages, some countries have developed structured data management processes to ensure accurate and consistent estimates of emissions from enteric fermentation and manure management sources. For example, Denmark’s national GHG inventory uses the Integrated Database Model for Agricultural Emissions (IDA), which collates data required for GHG inventory calculations as well as inventories of other environmental pollutants, such as ammonia (see Inventory Practice: Integrated data management in Denmark). The use of integrated data management systems is relatively common in Europe, where since the early 1990s the EU Nitrates Directive has required member states to control and report on agricultural nitrate pollution sources.
Existing data, information and other resources in the livestock sector
How a country implements the IPCC Tier 2 model or a country-specific Tier 2 approach is often strongly influenced by the availability of knowledge and data resources in the livestock sector. Common types of information resources that are used in inventory compilation include:
- feed tables
- energy balance models
- animal recording systems or herd registers, and
- datasets created for extension or other purposes.
The use of feed tables: Many countries, including those that use the IPCC model and country-specific models, use feed tables to estimate various parameters. Feed tables are often used to quantify the energy content of specific feeds, the mass of which is estimated from other sources (e.g. Country Case Study Ireland; Inventory Practice: estimating digestibility using a country-specific approach in the UK). In other cases, DMI or gross energy intake is directly estimated from feed tables (Country Case Study: Austria & India, Inventory Practice: The use of the Danish Normative System to estimate gross energy). This method assumes that farmers’ feeding practices are in line with the recommendations of feed tables. In relatively developed livestock sectors, this may be a reasonable assumption, especially where the feed tables are based on surveys of actual feeding plans. Elsewhere, this assumption may not hold, and alternative methods for estimating feed intake may be more appropriate (Goopy et al. 2018). Where countries lack national feed tables, feed tables or nutritional norms from other countries are sometimes used (Country Case Study: Ireland). The Freedipedia website provides information on the nutritional content of a large number of fodder and feed types, as well as links to ration formulation tools and other resources.
The use of energy balance models: Several countries use livestock energy balance models that were originally developed to inform farm advisory services. For example, the Danish inventory estimates the methane conversion factor using the Karoline model (Country Case study: Denmark, Inventory practice: The use of the Karoline model to predict methane yield) and the Swedish inventory uses the NORFOR model (Country case study: Sweden). The Netherlands has also developed a country-specific model to account for the high nutritional quality of dairy rations (Inventory practice: Modeling rumen processes in The Netherlands). The UK initially used the Feed into Milk model of dairy cow metabolism to estimate digestibility of dairy cow feed intake (Inventory Practice: estimating digestibility using a country-specific approach in the UK), and later expanded use of the model in the inventory (Country case study: UK). Where countries do not have an energy balance model developed in the country, most use the IPCC model, but some use models from other countries. Colombia has recently begun to use a generic model developed for tropical regions, undertaking national studies to validate the model for use in its national inventory (Country Case Study: Colombia).
The use of animal recording systems and herd registers: Delivery of farm advisory services often involves ongoing collection of farm data. Other databases exist because of livestock monitoring schemes, or herd registers compiled for breeding purposes. Statistical reporting systems and farm management surveys are also widely used to characterize livestock, feed sources and other management practices. Some countries use these databases directly as a source of inventory data, while others use the databases to provide estimates of specific parameter values (see Country Case: Denmark, Inventory Practice: Use of existing data on cattle diets in Denmark, Inventory Practice: Estimating milk yields in Slovenia). Although the data collected may not always be statistically representative of the whole livestock population, they are often the best available data, and their suitability for the GHG inventory may need to be verified. The existence of specific data sources may also influence the choice of methodological approach used for inventory compilation (Inventory Practice: The role of cow recording systems in Norway’s Tier 2 approach).
Processes and tools for structuring data compilation and management
The 2006 IPCC Guidelines (Vol 1 Chapter 2) provides generic guidance on data collection for inventory compilation. Methodological principles underlying the good practice set out therein are:
- Focus on the collection of data needed to improve estimates of key categories which are the largest, have the greatest potential to change, or have the greatest uncertainty.
- Choose data collection procedures that iteratively improve the quality of the inventory in line with the data quality objectives.
- Put in place data collection activities (e.g. resource prioritisation, planning, implementation, documentation) that lead to continuous improvement of the data sets used in the inventory.
- Collect data/information at a level of detail appropriate to the method used.
- Review data collection activities and methodological needs on a regular basis, to guide progressive, and efficient, inventory improvement.
- Introduce agreements with data suppliers to support consistent and continuing information flows.
In practice, countries use a variety of data sources when they establish their initial Tier 2 approach for enteric fermentation (see Estimate and measure emissions). Often the initial Tier 2 approach is developed on an ad hoc basis and subsequently improved over time. Among the diverse tools used, four have commonly been used to help structure the data collection and inventory compilation process:
- structured elicitation of expert judgement
- commissioned inventory design
- herd dynamics models, and
- inventory databases and data management systems.
Expert judgement processes
The 2006 IPCC Guidelines (Vol 1 Chapter 2) recognizes that expert judgement on methodological choice and choice of input data is fundamental to inventory development. Specific guidance on eliciting expert judgement is given in Annex 2A.1 to that chapter.
Analysis of 63 Tier 2 livestock inventories shows that for enteric fermentation by cattle, expert judgement was used by more than 20% of countries for initial estimates of animal weight and weight gain, proportion of time spent grazing, fat content of milk and proportion of cows giving birth (Figure 9).
Figure 9: Proportion of countries reporting use of expert judgement as a data source for various parameters
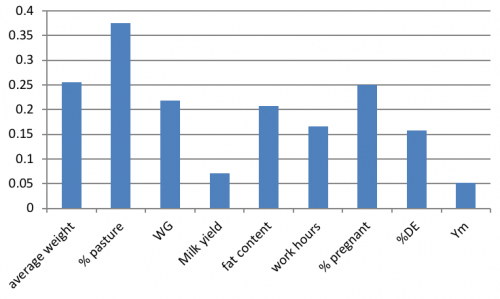
Expert judgement is applied in different ways. In some cases, data on specific parameters is entirely lacking, and data values are estimated by expert judgement. In other cases, various data sources are available, and the most appropriate data values are selected on the basis of expert judgement (e.g. Inventory practice: Improving estimates of live weight in New Zealand). Beyond these ad hoc uses of expert judgement for specific variables, structured expert judgement processes have also been used to compile data for an initial Tier 2 inventory. This is particularly useful where official data is limited and/or where production systems are extremely diverse and data availability is uneven. Examples using surveys of livestock experts and expert workshops are given in Inventory practice: Structured elicitation of expert judgement in Canada’s national inventory, Inventory practice: Structured elicitation of expert judgement on manure management systems in Canada, Inventory practice: Estimating digestible energy and methane conversion rates for feedlot cattle in the USA and Country Inventory Case Study: Colombia.
Commissioned inventory design
Several countries’ initial Tier 2 approach was achieved by commissioning design of the inventory. Country case studies from Ireland, New Zealand and Sweden all give examples where scientists from national agricultural research institutes were commissioned to elaborate the structure, methodology and data for the initial Tier 2 inventory. This can be useful where responsibilities for inventory compilation lie with a government ministry, but where the technical knowledge required for the Tier 2 approach is in the research community. Tier 2 inventories often evolve over time. Commissioned reviews and revisions play key roles in improving Tier 2 approaches, both through incremental improvements and through thorough revisions to the initial approach adopted (Country Case Study: New Zealand & Sweden; Inventory Practice: New Zealand’s agriculture advisory panel).
Inventory herd models
Some countries’ livestock emission inventories are based on models of livestock population dynamics. These models use national data on births, deaths and slaughter to model livestock sub-populations on a monthly basis, together with data on the characteristics of each sub-population, enabling a more accurate representation of annual emissions. Examples are given in Country Case Study: New Zealand and Inventory Practice: Livestock characterization and herd structure modeling in Georgia. These models provide a structure for inventory compilation as they set out the data parameters required. Reviews of the suitability of the model assumptions and data used can be undertaken to improve inventory accuracy over time (Inventory Practice: New Zealand’s agriculture advisory panel).
Inventory databases and data management systems
Inventory databases serve to structure data compilation and data management activities. Inventory databases can be designed in different ways with different capabilities, including:
- aggregation and storage of activity data, emission factors, and calculated emissions totals;
- data analysis and emission calculations;
- documentation of procedural information and published national inventory methodologies;
- facilitating quality assurance and quality control (QA/QC);
- reporting to the UNFCCC or another entity;
- data sharing among the national inventory team, government agencies, and others; and
- archiving of datasets, calculations, documentation, relevant studies, communications among inventory team members, and final submitted reports.
Some examples (not specific to the livestock sector) have been reviewed by Damassa et al. (2015). See also Inventory Practice: Integrated data management in Denmark. Data management systems can help facilitate collaboration among multiple agencies involved in inventory compilation, and contribute to the broader goals of inventory sustainability, transparency and consistency. Specialist inventory software can also support these objectives (Text Box 4).
Text Box 4 – Comparison of IPCC and ALU softwares for livestock Tier 2 approach
Two commonly used inventory softwares are the IPCC Inventory Software and Agriculture and Land Use Greenhouse Gas Inventory (ALU) Software. Both softwares cover all IPCC inventory sectors and categories, including livestock. In general, the functionality of each software is broadly similar (see Pulhin 2017). But for livestock their functionalities are different (Table 5). In the IPCC software (Version 2.5.4), users can define sub-categories of each livestock type and enter user-defined emission factors (e.g. Tier 2 emission factors) in place of the Tier 1 default values. However, the IPCC software cannot be used to develop Tier 2 emission factors for each livestock sub-category. ALU software, on the other hand, can be used to enter the secondary activity data required to estimate an emission factor for each sub-category of animal.
Table 5: Comparison of IPCC and ALU software functionalities for livestock
| Features | IPCC software (v 2.5.4) | ALU software (v 6.0) |
|---|---|---|
| User can define sub-categories of livestock | Yes | Yes |
| User can define manure management systems for each sub-category of livestock | Yes | Yes |
| User can define % of population of each sub-category in different climate zones | Yes | Yes |
| User can choose to use IPCC Tier 1 default emission factors | Yes | Yes |
| User can input parameter values to estimate Tier 2 enteric fermentation emission factors | No | Yes |
| User can input parameter values to estimate Tier 2 manure management methane emission factors | No | Yes |
| User can input parameter values to estimate Tier 2 manure management N2O emission factors | No | Yes |
| User can input activity data and emission factor uncertainty values | Yes | Yes |
Institutional dimensions of implementing a Tier 2 inventory
Developed countries’ GHG inventory systems have been designed to meet annual reporting obligations. Developing countries do not have annual reporting obligations. Many developing countries submitted their second national communication to the UNFCCC 10 years after their first communication, and their third on average more than 5 years later (Wilkes et al. 2017). The requirement to submit Biennial Update Reports, including an update to the national GHG inventory, was agreed in 2011. Many countries are still in the process of shifting from institutional arrangements designed for infrequent GHG inventory compilation to institutionalized approaches to enable more regular reporting.
The institutional arrangements developed in each country depend on arrangements for the overall inventory, not just the livestock inventory. But the way Tier 2 inventories are structured has implications for the inventory compilation processes and institutional arrangements required to accomplish regular compilation. Institutional arrangements can broadly be categorized into centralized and decentralized arrangements:
- Centralized compilation by an inventory compilation agency with activity data supply under memorandums of understanding (MoUs), data sharing agreement or contract: In Austria, Canada and Norway, a Tier 2 approach that uses data from a limited number of data sources facilitates centralized data compilation. In Denmark, the use of centralized databases facilitates collection of data from multiple sources on an annual basis for centralized compilation of the inventory (Inventory Practice: Integrated data management in Denmark).
- Decentralized compilation prior to submission to inventory compilation agency: In Finland and the UK, livestock emission sources are estimated by entities under MoU or contract to the inventory compilation agency.
Inventory agencies may retain roles in overall management of the inventory process, QA/QC and inventory improvement planning. In the Netherlands, the inventory is accomplished by working groups that coordinate data complilation and calculations prior to submission to the inventory compilation agency (Country Case Study: The Netherlands).
In addition to institutional arrangements for inventory compilation, many countries have developed institutional mechanisms to enable QA/QC activities, and review and continual improvement of the livestock inventory (e.g. Inventory Practice: New Zealand’s agriculture advisory panel).
Operational planning for a Tier 2 inventory
General guidance on implementation planning for national GHG inventories provided by the UNFCCC describes four main steps for source-specific planning (Figure 10). Further detailed steps are set out in general guidance presented in UNDP (2005). Many developed countries’ national inventory reports present a summary of the process for elaboration of the national inventory, including implementation plans. An example is provided in Inventory Practice: Institutional arrangements for compilation of Norway’s livestock emission inventory. There are few examples of operational plans for countries preparing their initial Tier 2 livestock inventory. However, Inventory Practice: Operational planning for a Tier 2 inventory in Kenya provides an example of an action plan from an ongoing inventory improvement process.
Figure 10: Source-specific planning tasks outlined in UNFCCC Guidance
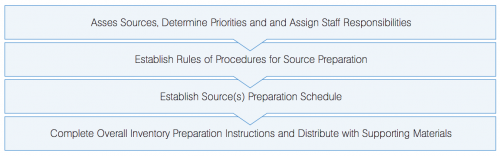
Source: UNFCCC Module 3: National Greenhouse Gas Inventories