

Keywords: livestock information resources | cow registers | dairy cattle
Country context: Until 2006, Norway used a Tier 1 approach for estimating enteric fermentation in cattle. Enteric fermentation was identified as a key source due to uncertainty in both the level and trend in emissions. NIR 2006 first adopted a Tier 2 approach. Norway’s Tier 2 approach is a country-specific method in line with IPCC guidance. It was designed to take advantage of information resources available in the livestock sector.
Livestock information resources used: Subsidy payment database; cow recording system; research.
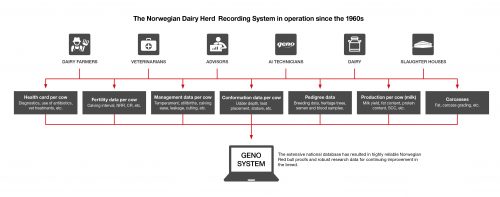
How did livestock sector information resources help shape the Tier 2 approach? Since the 1960s, the Norwegian Dairy Herd Recording System (NDHRS) has been operated by TINE SA, a farmer-owned dairy cooperative. The NDHRS covers almost all dairy cows in the country. The system collects a range of information on dairy cows that is used for various purposes, including animal health monitoring and genetic evaluation. Some of the information is also used in the national GHG inventory.
Source: Historical breeding program
Data on the population of 8 sub-categories of cattle in the GHG inventory derive from the official registry of production subsidies, which covers more than 90% of animals. Data on parameters used to estimate emissions per head per year for each sub-category derive from the NDHRS. The NDHRS includes records of physiological status (dry, lactating or pregnant), annual milk production, feeding, live weight, slaughter age, slaughter weight and average daily weight gain (ADG) for growing cattle, which are utilized in the calculations for growing cattle.
For dairy cattle, Norway’s Tier 2 approach takes account of both milk production levels and diet composition. In particular, Norway’s approach uses equations to estimate gross energy (GE) and methane conversion rate (Ym) on the basis of milk yield and feed characteristics, both of which are recorded in the NDHRS. Although the specific equations used to estimate GE and Ym have developed over time, the basic input data continue to be supplied by the NDHRS. The data available in the recording system have thus played a key role in shaping Norway’s choice of estimation method.
When Norway first developed its Tier 2 approach, more than a million observations from the NDHRS were used to develop standard lactation curves in 500 kg intervals from 4500 to 9500 kg (over a 305 day period). Standard feed rations for each 500 kg interval were then calculated using different combinations of forage quality and different levels of concentrate to produce low, medium and high energy content rations at each production level. These standard rations thus covered the normal range of forage qualities as indicated by the feed information in the NDHRS. Initially, feed energy values were estimated using the Dutch net energy lactation system that had been the official energy system in Norway since the early 1990s. Later, this was replaced by energy values estimated using the Nordic feed evaluation system (NorFor), but the overall approach remained the same.
For estimation of methane emissions, Norway’s initial Tier 2 approach used two equations based on overseas research that had been published in the literature: an equation by Mills et al. (2003) was used to predict daily CH4 production on the basis of feed intake and dietary ADF and starch content; and an equation described by Kirchgessner et al. (1995) was used to predict CH4 per day on the basis of crude protein and fat and NFE contents of the diets. The estimated CH4 emissions were taken as the average of the values predicted by these two equations.
The 305 day lactation curves and the standard feed rations modeled were then used to estimate average daily GE intake across each stage of lactation, at different milk yield levels and with different concentrate proportion in the diet. The reason this was done is because milk yield and concentrate proportion are available in the NDHRS. The resulting equation (GE = 150.8 + 0.0205 • Milk305 + 0.3651· Concentrate_prop) enables GE to be estimated on the basis of milk yield and concentrate proportion in the diet, both of which are available from the NDHRS. Another equation was also developed for Ym (Ym = 10.0 – 0.0002807 · Milk305 – 0.02304 · Concentrate_prop) that uses these input data.
These prediction methods were subsequently updated, but the methodological approach remains the same. On the basis of published research using the NorFor model (Storlein et al. 2014), a new equation predicting daily methane emissions on the basis of DMI and fatty acid content was used (CH4 (MJ/d) = 6.80 + 1.09 × DMI − 0.15 × FA), along with revised equations for GE (GE = 137.9 + 0.0249 × Milk305 + 0.2806 • Concentrate_proportion) and Ym (Ym = 7.15 – 0.00004 × Milk305 – 0.00988 × Concentrate_proportion). The estimated Ym values using the revised method were closer to those suggested in the IPCC 2006 Guidelines than the estimated values using the previous equations.
Thus, as Norway gradually improved the specific methods used to estimate dairy cattle emissions, the overall methodological approach remained the same. The availability of data from the NDHRS to populate the country-specific models was one key factor determining the choice of country-specific approach.
Further Resources
Norway Statistics Office, 2011. National Inventory Report, Appendix H: Enteric methane emissions from cattle and sheep population in Norway. Method description.
Storlein TM, Harstad OM. 2017. Enteric methane emissions from the cattle population in Norway. Annex IX in Norway NIR 2017.
Storlien TM, et al. 2014. Prediction of enteric methane production from dairy cows. Acta Agriculturae.
Scandinavica, Section A—Animal Science, 64(2): 98-109.
Author: Andreas Wilkes, Values for development Ltd (2019)