

The IPCC methodology for estimating livestock emissions
The 2006 Guidelines for National Greenhouse Gas Inventories recommend reporting on X sources of emissions associated with livestock systems. Guidelines for reporting methane emissions due to enteric fermentation and methane and nitrous oxide emissions generated by manure management can be found in Chapter 10: Emissions from livestock and manure management. Nitrous oxide emissions due to urine and dung deposited by grazing animals on pasture, range and paddock or animal manure applied to croplands are considered in Chapter 11: N2O emissions from managed soils, and CO2 emissions from lime and urea application. Guidelines for accounting for CO2 emissions due to conversion of land to or from pasture and changes in pasture management are covered in Chapter 6: Grassland.
Also, see AgLEDx Estimating Emissions from Enteric Fermentation & Manure Management and Sector Specific Guidance for MRV
How tier 2 approaches differ from Tier 1 approaches
Guidelines from the Intergovernmental Panel on Climate Change (IPCC) for national GHG inventory compilation and reporting provide different methodological options for estimating livestock GHG emissions (IPCC 1996, 2000, 2006).
Tier 1 methodologies use fixed values for GHG emissions per head of livestock, so changes in total emissions reflect only changes in livestock populations (Figure 1). This approach assumes that animals of different ages and breeding status have the same emissions and that emissions per head do not vary over time. The IPCC Guidelines provide Tier 1 default values for emissions per animal per year, which are applicable to broad continental regions, and do not reflect specific circumstances within countries (Text Box 1).
As of 2017, all but 21 developing countries use the Tier 1 IPCC default values for estimating enteric fermentation emissions in their national GHG inventories (Wilkes et al. 2017). Even where countries use national data to develop country-specific emission factors, these emission factors often do not change over time, so similar to Tier 1 default factors, reductions in livestock emissions can only be achieved if total animal numbers decrease. The value of a Tier 1 approach to policy makers is therefore limited.
Figure 1: Tier 1 approach to estimating livestock emissions
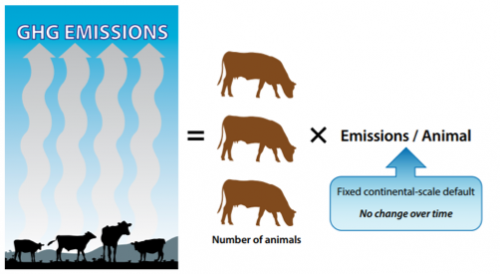
Source: GRA (n.d.) Livestock development and climate change
Figure 2: Tier 2 approach to estimating livestock emissions
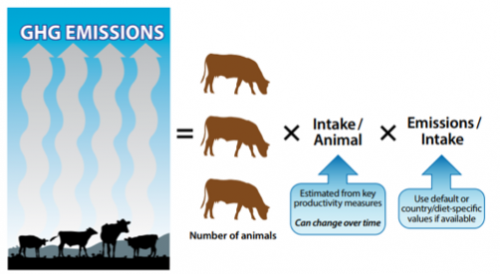
Source: GRA (n.d.) Livestock development and climate change
Tier 2 approaches require more detailed information on different types of livestock in a country, and data on livestock weight, weight gain, feed digestibility, milk yield and other factors reflecting management practices and animal performance. These data are used to estimate feed intake (either as dry matter or as gross energy) required by the animals to maintain the specified level of performance. Intake is then converted to methane emissions by multiplying energy intake by a methane conversion factor (methane emissions per unit of energy intake) (Figure 2). This conversion factor changes with the quality of animal diet. Therefore, a Tier 2 approach is better able to reflect management practices, diets and animal productivity in different production systems or regions of a country. Emissions per animal estimated using a Tier 2 approach can also change over time if data on management practices or productivity are updated (Text Box 2). A Tier 2 approach is therefore essential for capturing the effects of livestock development and climate change mitigation policies on emissions from the sector.
Using a Tier 2 approach in a national GHG inventory has several benefits:
- Where livestock emissions are key sources in a national inventory, IPCC Guidelines recommend the use of Tier 2 approaches to more accurately estimate emissions from these sources;
- Tier 2 approaches better reflect national circumstances and the actual production systems within a country (see Text Box 1);
- Tier 2 approaches can better capture changes in emissions intensity (GHG emissions per unit of livestock product output) due to increasing productivity, so Tier 2 approaches can enable countries to track trends in emissions intensity as well as absolute emissions (see Text Box 1). Examples of how emissions and emission intensity change over time at a country level can be found in case studies here.
- Tier 2 approaches provide more detail on production systems, and this information can be used to identify a wider range of mitigation options in the livestock sector. Examples of how a Tier 2 approach enables identification and assessment of mitigation options can be found here.
Some countries refer to their approach as a “Tier 2/Tier 3” or “Tier 3” approach. Tier 3 approaches are not clearly defined in IPCC guidance. IPCC (2006) suggests that Tier 3 approaches may use “sophisticated models that consider diet composition in detail, concentration of products arising from ruminant fermentation, seasonal variation in animal population or feed quality and availability, and possible mitigation strategies” and may address factors affecting feed requirements or variations in methane conversion rates. Some of these factors are also considered in country-specific Tier 2 models. Therefore, this collection of Tier 2 cases makes no distinction between Tier 2 and Tier 3 approaches.
Text Box 1 – Are emission factors higher or lower when Tier 2 approaches are used, and how do trends in emission intensity change? The example of dairy cattle
Tier 2 approaches are used to estimate enteric fermentation emissions from cattle in 62 countries’ national GHG inventories. National inventory reports from 48 countries provide sufficient information for dairy cattle to compare Tier 1 and Tier 2 emission factors, and comparisons of trends in emission intensity (kg CH4/kg milk) of dairy production are possible for 28 countries. These comparisons show that using a Tier 2 approach results in emission estimates that better reflect national conditions, and that reductions in emission intensity due to increasing productivity can be tracked if a Tier 2 approach is adopted.
Emission factors: When a Tier 2 approach was used to estimate dairy cattle enteric fermentation emissions, the Tier 2 emission factors were higher than the IPCC default Tier 1 emission factors in 40 out of 48 countries (i.e. 83%) (Figure 3). For countries with a higher Tier 2 emission factor, the average emission factor was 34% higher than the Tier 1 default. In the remaining 8 countries where Tier 2 was lower than Tier 1, the average Tier 2 emission factor was 20% lower than the Tier 1 emission factor. Extremely low and extremely high ratios of Tier 2 to Tier 1 emission factors shown in Figure 3 were mostly for countries whose actual production systems or dairy cattle performance differed significantly from the assumptions underlying the regional IPCC default values (see Inventory Practice: Verification of emission factors in South Africa).
Figure 3: Ratio of Tier 2 to Tier 1 emission factors for dairy cattle
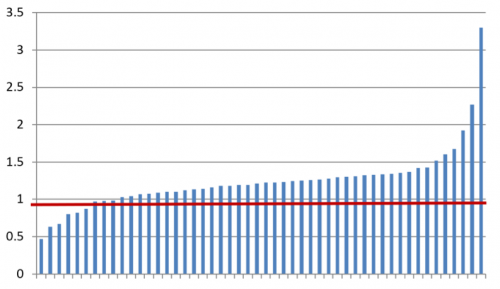
Note: The ratio is calculated as Tier2 dairy cattle emission factor in the first inventory reporting a Tier 2 approach compared to the appropriate default Tier 1 emission factor. A ratio <1 indicates a lower Tier 2 emission factor, and a ratio >1 indicates a higher Tier 2 emission factor.
Trends in emission intensity: Twenty-eight countries reported both annual milk yield per cow and the emission factor in such a way as to enable comparisons of the emission intensity of milk production between the initial use of the Tier 2 approach and the latest reported inventory. In 23 out of the 28 countries, emission intensity decreased (Figure 4). The average reported decrease in emission intensity was 10%. Among the 5 countries where emission intensity increased, the average increase was 13%.
Figure 4: Average change in emission intensity (EI, kgCH4/kg milk) between the first reported use of a Tier 2 approach and the latest reported inventory
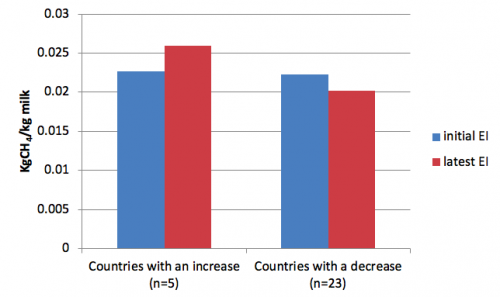
Source: this study
Text Box – 2 The use of Tier 2 approaches to reflect changes in emission factor over time
As of 2017, 63 countries used a Tier 2 approach for livestock in their national GHG inventories. Of these, 55 provided sufficient information in the latest national inventory report (NIR) to tell whether the Tier 2 approach is applied in a way that enables updating of emission factors, or whether a static emission factor was used (i.e. the emission factor is country-specific, but remains unchanged between years) (Table 1).
For dairy cattle, 45 countries (71%) currently use a dynamic approach, including 8 countries that started with a static emission factor but now have a dynamic inventory system. For other (i.e. non-dairy) cattle, a greater proportion (24%) currently uses a static emission factor, but 17 countries have moved from an initial static emission factor to their current dynamic system. Some countries use a dynamic emission factor for dairy, but a static one for other cattle. Common reasons given include the assumption that there has been no change in the diets of non-dairy cattle and the relatively lower significance of emissions from other cattle in the national inventory.
Table 1: Number of countries using dynamic approach or static EFs for dairy and other cattle emissions
| Dairy cattle | Other cattle | |||||
|---|---|---|---|---|---|---|
| Dynamic | Static | Unknown | Dynamic | Static | Unknown | |
| Initial inventory | 37 (58%) | 21 (33%) | 5 (8%) | 22 (35%) | 35 (56%) | 5 (8%) |
| Latest inventory | 45 (71%) | 10 (16%) | 8 (13%) | 39 (63%) | 15 (24%) | 8 (13%) |
Source: this study
How Tier 2 can help with MRV of mitigation actions and NDCs
The Paris Agreement came into force in November 2016. UNFCCC Decision 1/CP.20 invited Parties to submit their intended nationally determined contributions (INDCs) to the Conference of Parties, and Decision 1/CP.21 invited Parties to communicate their first nationally determined contribution (NDC) by the time the Party ratifies the Paris Agreement. For most countries, their INDC became their first NDC.
By April 2018, 175 of the 197 Parties to the UNFCCC had ratified the Paris Agreement. For developed countries, NDCs should be economy-wide absolute emission reduction targets (Paris Agreement, Article 4.4), while developing countries should move toward economy-wide emission reduction or limitation targets over time. Livestock emissions are thus included in the NDCs of most developed countries. Analysis of the INDCs of 150 developing countries shows that 48 countries explicitly mention intentions to reduce emissions from livestock-related sources in their INDC, while a further 44 countries include livestock in the scope of their NDC along with the agriculture sector in general or as part of an economy-wide target (Wilkes 2017). In addition, at least 17 countries have proposed nationally appropriate mitigation actions (NAMAs) to reduce livestock-related emissions.
Most developing countries have proposed NDCs in the form of deviations from a business-as-usual emission scenario, although some have proposed absolute emission reductions or reductions in emission intensity (Wilkes et al. 2017). National GHG inventories will be a key tool in measuring and reporting progress in achievement of NDCs. Since few countries propose reductions in absolute numbers of livestock, it will be essential that national GHG inventories are able to reflect changes in management practices and productivity due to livestock sector or climate policy measures. Tier 2 approaches in national GHG inventories will be required. Where countries intend to implement mitigation actions in specific livestock sub-sectors or regions in a country, Tier 2 approaches will also be needed (see Inventory Practice: Aligning national GHG inventories, NDCs and NAMAs in Kenya).
Text Box 3: Data sources used to compile this collection
As of 2017, Tier 2 approaches were used by 63 countries for estimating livestock emissions in their national GHG inventories, including 42 developed countries and 21 developing countries. For this overview of how countries use Tier 2 approaches, information was reviewed from developed country national inventory reports (NIRs) since 2003 that are available on the UNFCCC website. For developing countries, we used NIRs where they could be found either on the UNFCCC website or on national websites, and inventory summaries in national communications and Biennial Update Reports (BURs) where no separate NIR document could be found. Information on the specific practices used by developing countries is more limited, because developing countries are not required to submit full NIRs.
Overview of how countries use Tier 2 approaches for livestock
How many countries are using a Tier 2 approach?
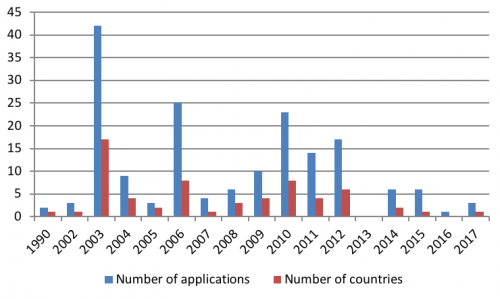
As of 2017, 63 countries use or have used a Tier 2 approach for one or more types of livestock. A Tier 2 approach is used for enteric fermentation by 62 countries for dairy cattle, 62 countries for other cattle, 32 countries for sheep and 18 for pigs. Together, these livestock types account for about 80% of global livestock emissions (FAOSTAT). A smaller number of countries have also used Tier 2 approaches for goats, buffalo, equids, deer, reindeer, rabbits and other animal types. About 50% of first applications have occurred in the last 10 years, and just over 45% of countries first used a Tier 2 approach in the last 10 years (Figure 5).
Figure 5: Number of countries and instances of first use of Tier 2 approaches from 1990-2017
Most countries applying a Tier 2 approach to enteric fermentation for cattle also apply a Tier 2 approach to CH4 emissions from manure management, and about one third also apply a Tier 2 approach for cattle manure N2O emissions (Table 2). More countries use a Tier 2 approach for pig manure management than for enteric fermentation from pigs.
Table 2: Application of Tier 2 approaches to different GHG sources from different livestock types
| Enteric fermentation | CH4 manure management | N2O manure management | N2O pasture deposit | |
|---|---|---|---|---|
| Cattle | 62 | 57 | 22 | 11 |
| Sheep | 32 | 18 | 17 | 9 |
| Pigs | 18 | 33 | 18 | - |
The IPCC Tier 2 model and other country-specific Tier 2 approaches
The IPCC guidelines provide flexibility for how the Tier 2 approach is implemented. The IPCC guidelines elaborate a specific model of enteric fermentation (the ‘IPCC model’) that is largely based on ruminant net energy models described in NRC (1984, 1989). Other models that are consistent with the IPCC Guidelines may also be used (‘country-specific approaches’).
For enteric fermentation, the IPCC model has been used in about two thirds of applications for dairy and other cattle. About one third of the total number of Tier 2 applications for cattle use country-specific approaches consistent with the IPCC guidance. Three countries (i.e. Denmark, Ukraine, United Kingdom) began by using the IPCC model but later changed to a country-specific approach (see Country Case Study: Denmark & United Kingdom). Thus, once a country adopts either the IPCC model or a country-specific approach, most countries tend to stick with the same approach and make improvements over time within that methodological approach.
The IPCC Tier 2 model
The IPCC Tier 2 model is set out in the 1996 and 2006 Guidelines and 2000 Good Practice Guidance. The IPCC model for enteric fermentation is largely based on ruminant net energy models described in NRC (1984, 1989). In brief, emission factors for each animal category are based on estimated daily gross energy intake (GE) or feed intake (expressed as dry matter intake, DMI) and a methane conversion rate (Ym, % of gross energy in feed converted to methane). Daily emissions per head are then converted to annual emissions per head:
[Eq. 1] EFi = [GEi ● Ymi ● 365] 55.65
where
i = index of each livestock category
EFi =emission factor (kg CH4/head/year)
GE = gross energy intake (MJ/head/day)
Ym= methane conversion rate (% of gross energy in feed converted to methane)
55.65 = energy content of methane (MJ/kg CH4).
Since direct measurements of feed intake are rarely available, the IPCC model estimates gross energy intake from animal performance data reflecting the net energy required for maintenance, activity, growth, lactation and other functions. To estimate gross energy intake for cattle using the IPCC model, the following data is required for representative animals of each category (IPCC 1996):
- weight (kg)
- average weight gain per day (kg)
- feeding situation (i.e. confined animals; animals grazing good quality pasture; and animals grazing over very large areas)
- milk production per day (kg/day)
- average amount of work performed per day (hours/day)
- percentage of cows giving birth in a year; and
- feed digestibility (%).
The IPCC guidelines also set out tiered approaches for estimating manure management emissions. Once a Tier 2 approach is used for enteric fermentation, the same input data describing feed intake and digestibility are used to calculate volatile solid excretion for estimating methane emissions from manure management. Enhanced characterization of animals and diets can also provide the information required for Tier 2 estimation of nitrous oxide emissions from manure management.
Often, when a country adopts the IPCC Tier 2 model, not all data required for the Tier 2 approach are immediately available. However, default values and other sources of data can be used where statistical data or national research data are unavailable. Chapter 3 of this document describes the different sources of data that countries have used for the various parameters in the IPCC model for enteric fermentation and manure management emissions from cattle, providing a comparison of data sources used in the initial Tier 2 inventory with data sources in subsequent inventories. Country Case Studies for Bulgaria, Estonia and the United Kingdom describe how these countries have implemented the IPCC model for cattle in their national GHG inventories, as well as the improvements they have made over time.
The 2006 IPCC Guidelines recognize the potential for refinement of the IPCC model by using methods that incorporate factors that affect feed demand or feed intake or that affect the methane conversion rate (Ym), such as diet chemical composition. Some countries have implemented such refinements within the framework of the IPCC model. Examples include Slovenia and the United Kingdom, which have developed country-specific methods for estimating feed digestibility that are applied within the framework of the IPCC model (Inventory practice: Estimating digestibility using a country-specific approach in the UK, Inventory practice: Accounting for effects of increased concentrate use on gross energy intake and digestible energy in Slovenia).
Country-specific approaches
The basic elements of the IPCC approach for enteric fermentation are described in Eq. 1 above. In addition to refinements to the IPCC model aimed at improving estimates of feed intake or methane conversion factors, the IPCC Guidelines (IPCC 2006) encourage the use of Tier 3 approaches that use sophisticated models that consider diet composition and rumen fermentation processes in more detail, or that represent seasonal trends. Several countries have thus implemented country-specific approaches that represent more significant departures from the IPCC model. Many of these approaches can be considered Tier 2 or Tier 3 approaches.
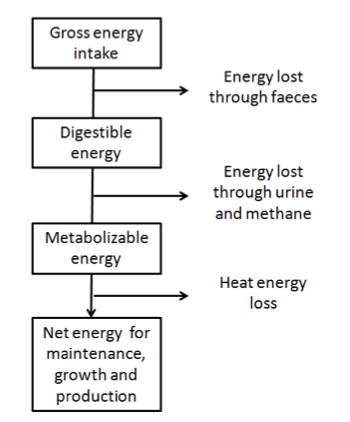
Figure 6: Generic livestock energy balance model
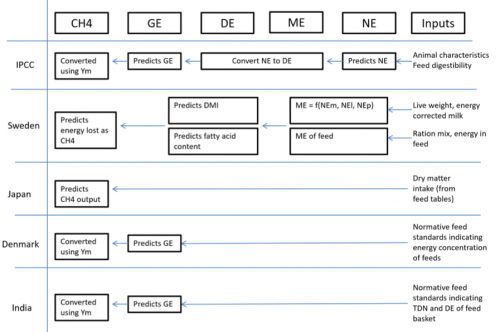
In general, both IPCC and country-specific approaches are based on a common livestock energy balance model that relates gross feed energy intake to net energy for maintenance and production (Figure 6). However, the specific method used to translate animal characteristics, feed characteristics or animal performance into estimates of intake, and the methods used to transform energy intake into methane emissions vary. Descriptions of selected country-specific approaches and their evolution over time are given in the Country Case Studies for Austria, Colombia, Denmark, India, Ireland, Japan, The Netherlands, New Zealand and Sweden. Figure 7 provides a stylized overview of some of these countries’ approaches in comparison to the IPCC model.
Figure 7: Selected country-specific approaches in comparison to the IPCC model for enteric fermentation
The reason why countries have adopted their country-specific Tier 2 approach varies. Common factors reflected in country-specific approaches include:
- Country context: in some cases, a countries’ model was developed to better account for feed characteristics. For example, several European countries’ approach was developed to specifically account for emissions when dairy rations have a higher content of highly digestible feed, such as concentrate, silage or sugar beet (e.g. Ireland, Denmark, United Kingdom). Australia’s approach (later adapted by New Zealand) was specifically elaborated for grazing livestock systems.
- Existing energy balance models: Country-specific approaches, including underlying energy balance models and methane production models, have been developed on the basis of existing models used in the livestock sector. For example, Denmark’s country-specific approach is based on the Danish Normative System for formulating feeding plans; Sweden’s inventory approach is based on the NORFOR feed evaluation system used by Swedish dairy farmers. Ireland’s inventory approach is based on the French INRA nutrition system, which was widely used by Irish farmers when they adopted a Tier 2 approach. These feed and energy balance models in most cases pre-existed the GHG inventory Tier 2 approach. As these models evolved, so did the approach in these countries’ GHG inventories.
- Existing extension tools and datasets: Feed tables and other analytical tools are primarily developed to help farmers improve cattle nutrition. Several tools are linked to databases containing animal recording information, and these datasets are used by some countries as a key source of information to characterize ‘typical’ diets and farm management practices (e.g. Inventory practice: Use of existing data on cattle diets in Denmark), to directly provide activity data (e.g. milk production data used in Sweden’s inventory) or both (Inventory Practice: The role of cow recording systems in Norway).
- Prior and ongoing research: These energy balance models and extension tools were generally based on prior research. As research continues, these resources have been updated, and the approach to enteric fermentation modeling in GHG inventories has evolved alongside them. This has included changes in how rumen function is modeled (e.g. Netherlands), how energy balance is modeled (e.g. Sweden), and research on methane conversion factors (e.g. New Zealand). Much of this research has been primarily motivated by animal nutrition objectives, rather than inventory needs alone.
- Broader environmental policies: Several European countries’ inventory approaches were strongly shaped by monitoring systems set up in relation to nitrate pollution in the early 1990s (e.g. Norway, Austria) and/or informed by prior research on feed intake and feed characteristics conducted to inform nitrate pollution control policies.
Many of the knowledge resources used in developing and applying country-specific approaches may also be applicable within the IPCC model. Examples of how these resources are used to meet specific inventory needs are described in the inventory practice case studies.