

Keywords: filling data gaps | milk yield | extrapolation | dairy cattle
Country context: In the early 2000s, when Slovenia adopted a Tier 2 approach, cattle were responsible for about 90% of enteric fermentation emissions. The proportion due to dairy cattle has been declining over time, and in NIR 2017 less than 50% were from dairy cattle. However, average milk yield has been increasing from 2775 kg/head/year in 1990 to about 5590 kg/head/year in 2015.
What data needs were addressed? Distribution of milk yield in the dairy cow population
Why was the data needed? Slovenia’s national GHG inventory applies the IPCC model in a country-specific approach. In the initial Tier 2 submissions (e.g. NIR 2003), the IPCC model was used to estimate enteric fermentation methane emissions for 18 sub-categories of dairy cow defined by the level of milk yield (e.g. 1000 1500 L/ head/year; 1500 2000 L/ head/year…>9000 L/ head/year). A statistical relationship was then established between CH4 emissions/head/year and milk yield kg/head/year. One option would be to apply the relationship to the average yield, but a better estimate would be obtained if the distribution of milk yields in the dairy cow population is known. Once the distribution of dairy cow milk yield in the population is known, then the inventory compiler can then estimate CH4 emissions using this activity data. However, there was no official data that reports the distribution of milk yields for all Slovenian dairy cows. Milk yield monitoring data was available, however, from a sub-set of the dairy cow population.
Methods used: extrapolation.
How was the data gap addressed? In 1999, the Cattle Breeding Service of Slovenia was monitoring monthly milk production by approximately 30% of the total dairy herd. These are referred to as ‘controlled cows’. Inspection of this data revealed that the annual milk yield data has a gamma function distribution. The average milk yield of the controlled cows, total cow population and total milk production from statistical data (with adjustment for suckling by calves) was used to estimate the distribution of milk yield in the non-controlled cow population, assuming that it shared the same distribution as the data from the controlled cows. An iterative method was used to fit the gamma function to the non-controlled population such that the average milk yield estimated was equal to the average milk yield implied by the national statistical data. The controlled and (modeled) non-controlled populations were then combined (Figure 1). The resulting data on the numbers of cows producing at different levels of milk yield, was then applied to the estimated emission factor appropriate to each level of production to estimate total dairy cow enteric fermentation emissions.
Figure 1: Theoretical distribution of the controlled herd (□), adjusted non-controlled herd (∆) and the entire, mathematically combined herd (○) of dairy cows
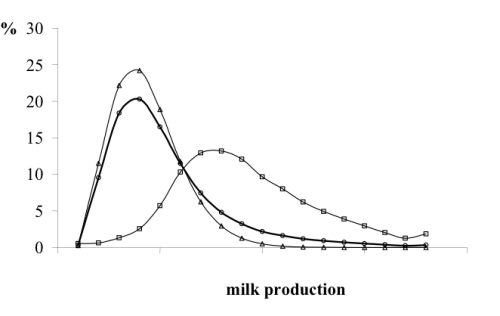
Source: Slovenia NIR (2004)
Author: Andreas Wilkes, Values for development Ltd (2019)