

Keywords: filling data gaps | livestock characterization | interpolation | extrapolation
Country context: Almost all enteric fermentation emissions in Austria are from cattle and Austria uses a Tier 2 approach for both dairy and non-daiary cattle. Since the mid-1990s, after Austria joined the EU, financial support for suckling cows increased (i.e. cattle are primarily raised for veal and beef with the milk of the cow only provided for the suckling calves), especially in mountain areas where the production system contributes to conservation of the traditional landscape. The area under organic production has grown, and now covers about 18% of total farm area in the country.
What data needs were addressed? Distribution of non-dairy cattle between organic and non-organic production systems.
Why was the data needed? Austria’s country-specific enteric fermentation approach estimates GE from the typical dry matter intake (DMI) of cattle (see Austria country case study). Diets vary considerably between organic and non-organic production systems. Thus, it is necessary to estimate how many cattle are raised in organic and non-organic production systems. In Austria’s initial inventory submissions, data on numbers of cattle on organic farms was available from the databases of INVEKOS, the control system used to manage EU subsidy payments. However, for some years the INVEKOS database did not provide a breakdown of the cattle population by sub-category of cattle. Furthermore, the subsidy programs covering cattle later ended and the inventory switched to a new data source on the organic cattle population from the Ministry of Agriculture’s ‘Green Report’. However, this change in data source resulted in missing data for some years not captured in either source. There were data gaps for the years 1990 1996 and for 2001 2003.
Methods used: trend extrapolation, interpolation of available data, expert opinion.
How was the data gap addressed?
For all major animal categories, the average share of organic farming in total agricultural land area in the 1997-2000 period was calculated from the INVEKOS data. This average share was then allocated to all animal sub-categories, assuming also that the cattle in organic and conventional farms have the same herd structures. This provided an estimate of the proportion of organic and non-organic cattle of different types. This structure was applied to the years 1990-1996 by extrapolating a trend in the animal population in organic and conventional farms based on the trend in existing data on the number of farms that apply organic farming practices. For the years 2001-2003, the data for 2000 was used, with no assumed trend over these years. After 2003, data from the Ministry of Agriculture’s ‘Green Report’.
The resulting estimate of livestock population in organic and conventional farming systems in different periods is shown in the table below. Because organic and non-organic cattle diets vary, the resulting activity data was then applied to different estimates of gross energy (GE) intake for each sub-type of cattle in each production system.
Table 1. Estimated proportion of the population of cattle sub-types in organic production systems in Austria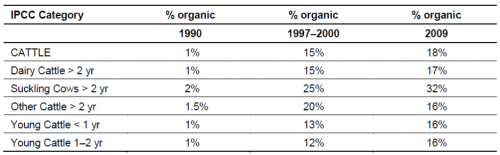
Source: Austria NIR 2011
Author: Andreas Wilkes, Values for development Ltd (2019)