

The agriculture sector in Denmark contributes 21% of the country’s overall GHG emissions, excluding LULUCF. Denmark’s agriculture emissions are dominated by the livestock sector, primarily due to the production of dairy and non-dairy cattle and swine. Methane (CH4) is the largest contributor to the overall agricultural emissions, accounting for 54% of the sector’s CO2-equivalents in 2015 (Figure 1).
Figure 1. Greenhouse gas (GHG) emissions by the agriculture sector from 1990 2015 (1)
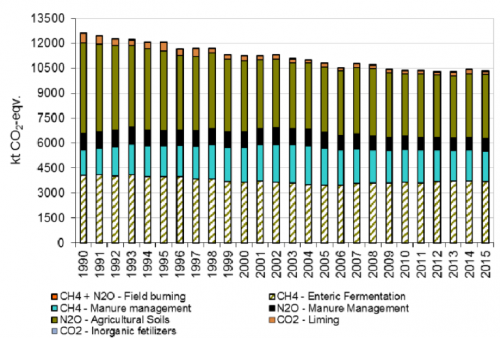
Source: Denmark NIR 2017
Overview of Denmark’s current Tier 2 approach
Denmark adopted the IPCC Tier 2 approach for cattle enteric fermentation in the 1990s. In 2003, a thorough revision of the inventory methodology was undertaken, leading to extension of the Tier 2 approach to other animal types and adoption of a country-specific refinement to the IPCC Tier 2 approach.
Table 1: Tiered approaches used for livestock in Denmark’s national GHG inventory
| Livestock types | Tier used for enteric fermentation (CH4) | Year adopted* | Tier used for manure management (CH4) | Year adopted* |
|---|---|---|---|---|
| Dairy cattle | T2 | Before 2003 | T2 | Before 2003 |
| Non-dairy cattle | T2 | Before 2003 | T2 | Before 2003 |
| Sheep | T2 | 2004 | T2 | 2004 |
| Pigs | T2 | 2004 | T2 | 2004 |
| Other (horses, goats, deer) | T2 | various | T2 | Various |
*Year refers to the year of NIR submission
Table 2: Livestock categorization method
| Dairy cattle | Non-dairy cattle | Swine |
|---|---|---|
| 35 categories based on animal type (defined by age, physiological status, breed) and housing system | 129 categories based on animal type (defined by age, physiological status, breed) and housing system | 3 categories: sows, weaners, fattening pigs |
Calculation of enteric fermentation emissions from cattle
Emissions from enteric fermentation are calculated using a methodology based on 2006 IPCC Guidelines. A Tier 2 approach is used for all ruminants and swine. Calculations for cattle are based on the sum of emissions in the winter and summer feeding seasons (Figure 2). During the summer the ration mainly consists of grass, whereas during the winter roughage and concentrate feeds are fed. The equations for dairy cattle used to specifically include sugar beets in the winter ration, which result in higher methane emissions. However, in recent years sugar beet production in Denmark has declined significantly and they are no longer a major part of the feed ration.
Figure 2. Denmark’s equation for emission factor calculation for dairy cattle
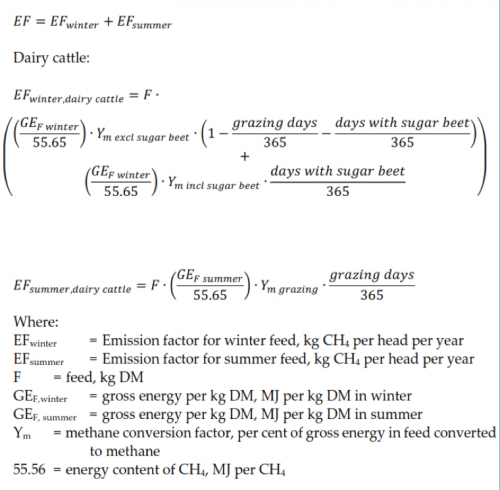
Source: Denmark’s NIR 2017
Calculation of gross energy per kg DM relies on the Danish Normative System. The Danish Normative System is used for fertilizer planning and control by Danish famers and authorities (Poulsen et al. 2001; Poulsen 2016). The Danish normative standards are based on practical farming and thus reflect actual Danish agricultural production characteristics. The normative standards are developed annually by the Danish Centre for Food and Agriculture (DCA) on the basis of data received from SEGES, which is the central office for all Danish agricultural advisory services. SEGES collects efficacy reports from Danish farmers, to optimize productivity in Danish agriculture, as well as conducting other research.
In the dairy sector, 10% of the Danish farmers are part of an intensive monitoring system. Four to five times a year, detailed data including livestock numbers, animal weight and feeding plans (e.g. rations, nutrient content) is collected. This includes any feed bought from outside the farm. Furthermore, 50% of the Danish farmers participate in an annual monitoring system, which includes ‘spot’ samples on feeding plans. Data collected from the 50% of farmers are compared with the 10% farmers who are monitored in greater detail and more intensively. This comparison serves data verification purposes and gives an indication of whether the 10% can serve as ‘model farmers’ for the normative system. Based on the very detailed production data, normative standards are then established. In total the normative standards cover feed plans from 15-18% of the Danish dairy production. Previously, the normative standards were updated and published every third or fourth year. Since 2001 these standards have been updated annually and are available to download from the homepage of DCA.
To calculate the total gross energy (GE) intake, the GE per kg DM (GFF) or GE per feed unit (GEFU) is estimated. A feed unit in Denmark is defined as the feed value in 1.00 kg barley with a dry matter content of 85%. For other cereals, e.g. wheat and rye, one feed unit is 0.97 kg and 1.05 kg, respectively.
For dairy cattle, gross energy intake is estimated by DCA, based on detailed data from feeding plans as collected annually by SEGES. From 2014 feed intake for dairy cattle given in the normative figures are given in kg DM per year and the energy in the feed is given in MJ per kg DM. The energy intake is a standard winter feed regardless of whether the animal grazes or not. For all livestock categories other than dairy cattle, the estimation of gross energy (GEFU) is based on the composition of feed intake and the energy content in proteins, fats and carbohydrates based on feeding controls or actual feeding plans at farm level, collected by SEGES or DCA. In contrast to dairy feed data, this feeding data is collected every 3 to 4 years. The data are given in Danish feed units or kg feedstuff and these values are converted to mega joule (MJ):
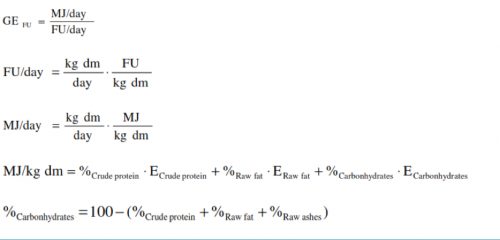
Source: Denmark NIR 2017
Feeding data collected by SEGES have shown a shift in feeding practices from sugar beets to maize (whole cereal). Due to the higher content of easily convertible sugar, sugar beets resulted in higher methane emissions than maize or grass. This change in feeding practices is reflected in the average methane conversion factor (Table 3).
Table 3: Development of Denmark’s methane conversion rate (Ym) for dairy cattle and heifers > 0.5 years between 1990 and 2015 (%)
| 1990 | 1991 | 1995 | 2000 | 2002 2015 | |
|---|---|---|---|---|---|
| Ym incl. sugar beet | 6.70 | 6.70 | 6.45 | 6.13 | 6.00 |
| Ym excl. sugar beet | 6.00 | 6.00 | 6.00 | 6.00 | 6.00 |
| Ym grazing | 6.00 | 6.00 | 6.00 | 6.00 | 6.00 |
| Ym average | 6.38 | 6.38 | 6.24 | 6.07 | 6.00 |
Source: Denmark’s NIR 2017
The estimation of the national methane conversion factors is based on the model ‘Karoline’ developed by DCA and is based on the average feeding plans obtained from SEGES (Olesen et al. 2005). Initially, DCA estimated methane emissions for a winter feeding plan for two years, 1991 (Ym=6.7) and 2002 (Ym=6.0) and estimated Ym for the years between 1991 and 2002 using interpolation. New measurements by Hellwing et al. (2014) resulted in new methane conversion factors of between 5.98 and 6.13.
Figure 3: Integrated database model for agricultural emissions, Denmark
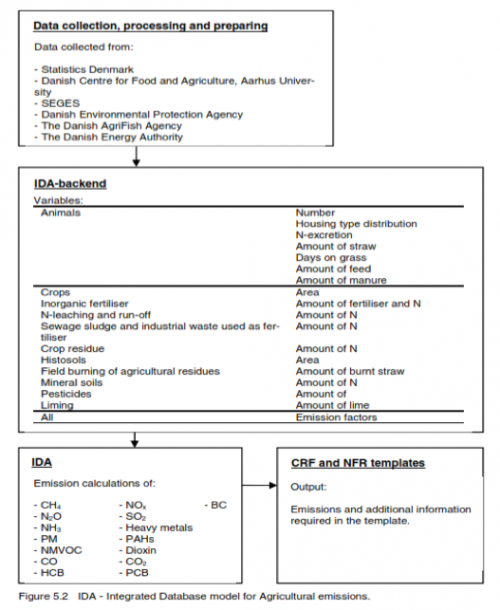
Source: Denmark NIR 2017
Manure management emissions
The emissions from the agricultural sector are calculated in a comprehensive agricultural model complex called IDA (Integrated Database model for Agricultural emissions, Figure 3). The model is designed in a relational database system (MS Access). Input data are stored in tables in one database called IDA Backend and the calculations are carried out as queries in another linked database called IDA. This model complex is implemented in great detail and is used to cover emissions of air pollutants and greenhouse gases. There is therefore a direct coherence between input data used to estimate enteric fermentation and manure management methane emissions, as well as between this and the data used to estimate ammonia (NH3) and N2O emissions.
Most emissions relate to livestock production, which is based on information on the number of animals, the distribution of animals according to housing type and information on feed consumption and excretion. IDA operates with 39 different livestock categories, according to livestock type, weight class and age. These categories are subdivided into housing type and manure type, which results in 269 different combinations of livestock sub-categories and housing types. For each of these combinations, information on feed intake, digestibility, excretion, grazing days and other parameters is included. The emission is calculated from each of these subcategories and then aggregated in accordance with the IPCC livestock source categories given in the Common Reporting Formats.
Roles and responsibilities in inventory compilation
Activity data and emission factors are collected and discussed in cooperation with specialists and researchers in various institutes with agricultural expertise, including SEGES, DCA, Aarhus University and Statistics Denmark. An overview of key institutes and organizations involved in Denmark’s agriculture emission inventory, and key data/information collected is provided in Table 4.
The Danish Centre for Environment and Energy (DCE) and Aarhus University have established data agreements (MOUs) with the institutes and organizations to ensure that the required data is available to prepare the emission inventory on time. Data is shared with DCE and Aarhus University, and updated in the Integrated Database Model on an annual basis. Close cooperation between research and advisory services (SEGES) allows research to work with actual and high quality data, while advisory services have actual core data to its disposal enabling high quality advisory services and the provision of benchmarks to their farmers.
Table 4: Institutes involved in Denmark’s agriculture emission inventory
| Institute | Key data/information collected |
|---|---|
| Statistics Denmark Agricultural Statistics | • Livestock production • Milk yields • Slaughtering data • Export of live animals poultry • Land use • Crop production • Crop yields |
| Danish Centre for Food and Agriculture (DCA), Aarhus University | • N-Excretion • Feeding plans • Animal growth • Use of straw for bedding • N-content in crops • Modelling of data regarding N-leaching/runoff • NH3 emission factor |
| SEGES | • Housing type (until 2004) • Grazing situation • Manure application time and methods • Estimation of extent of field burning of agricultural residues • Acidification of slurry |
Source: adapted from Denmark’s NIR 2017
Factors contributing to development of the approach over time
Data availability has played a key role in the development of Denmark’s approach. Due to the European Nitrates Directive coming into force in 1991, a nation-wide monitoring program was established in Denmark. All aspects of the aquatic environment, including key drivers of nitrogen leaching, such as the agriculture sector, were included in the monitoring program.
In 1996, SEGES and Aarhus University realized that the nation-wide monitoring program resulted in a great source of detailed information on agriculture practices, including feeding practices and manure management. Since 1996 this data has thus been integrated in the national GHG inventory, which enabled the shift from a Tier 1 to Tier 2 approach.
The availability of the database of feeding plans has likewise facilitated the development of country-specific methane conversion factors. This database exists due to the strong farmer advisory system in the country. Denmark’s first agricultural advisory was as early as 1874. Farmers participating in the annual monitoring are mainly interested in the performance benchmarks the monitoring system produces. At the same time, the resulting data provide actual and up to date input data for use in the national inventory.
(1) From 1990 to 2015, emissions decreased from 12.6 million tonnes CO2 equivalents to 10.3 million tonnes CO2 equivalents (~18% reduction). The total N2O emission from 1990-2015 decreased by 28% and can largely be attributed to the decrease in N2O emissions from agricultural soils. A 9% reduction in methane emissions from enteric fermentation over the last years can mainly be explained by a reduction in cattle number.
Further Resources
Helping ALF, et al. 2014: Note: Calculation of Ym for dairy cows in Denmark. Department of Animal Sceince, Aarhus University, AU Foulum, P.O. Box 50, DK-8830 Tjele, Denmark.
Olesen JE, et al. 2005. Evaluering af mulige tiltag til reduction af landbrugets metanemissioner. Arbejdsrapport fra Miljøstyrelsen Nr. 11 /2005. Chapter 1 (Allan Danfær): Methane emission from dairy cows.
Pulse HD. 2016. Normative figures 2000-2015. DCA Danish Centre for Food and Agriculture, Aarhus University.
Poulsen HD, et al. 2001. Kvælstof, fosfor og kalium i husdyrgødning normtal 2000. DJF rapport nr. 36 husdyrbrug, Danmarks Jordbrugsforskning. (In Danish).
Author: Andreas Wilkes, Values for development Ltd (2019)