

Overview of New Zealand’s current Tier 2 approach
Grassland-based animal husbandry makes major contributions to New Zealand’s economy, and production practices and productivity have changed considerably in recent decades. Key categories in the latest inventory include enteric fermentation emissions from dairy cattle, non-dairy cattle, sheep and deer; manure management methane emissions from dairy cattle, and direct N2O emissions from urine and dung deposited by grazing animals (NIR 2017). New Zealand currently reports emissions from dairy and non-dairy cattle, sheep and deer using Tier 2 approaches (Table 1). A country-specific Tier 1 emission factor is used for goats and the IPCC default is used for pigs, as these emission sources are not significant. New Zealand began using a country-specific Tier 2 approach for livestock enteric fermentation in the early 1990s. Initially, static emission factors were used that did not change along with changes in production practices or animal performance. Since 2003, a full Tier 2 approach has been adopted in which enteric fermentation emissions per head per year vary according to changes in production practice and animal performance.
Table 1: Overview of Tiers used for livestock methane emissions in New Zealand’s national GHG inventories
| Livestock types | Tier used for enteric fermentation (CH4) | Year adopted* | Tier used for manure management (CH4) | Year adopted* |
|---|---|---|---|---|
| Dairy cows | T2 | 2003 | T2 | 2006 |
| Beef cattle | T2 | 2003 | T2 | 2006 |
| Sheep | T2 | 2003 | T2 | 2006 |
| Goats | CS T1 | 1994 | T1 | - |
| Deer | T2 | 2003 | T2 | 2006 |
| Pigs | T1 | - | T1 | - |
*Year refers to the year of NIR submission
Enteric fermentation
Approach used: Since 2003, New Zealand has used country-specific approaches to estimate enteric fermentation emissions from the major ruminant livestock categories. Because country-specific data and monthly data intervals are used for livestock populations, productivity and pasture quality, the approach may be considered to be close to a Tier 3 methodology.
How the approach has developed over time: New Zealand’s livestock emissions inventory has undergone three distinct phases of development.
(1) 1994 2001: Tier 1/ Tier 2 approach
Even before the IPCC 1996 Guidelines were released, New Zealand was reporting livestock emissions using a country-specific approach similar to the approaches later set out in the IPCC Guidelines. In 1990, the Ministry for the Environment commissioned an inventory of enteric methane emissions (Ulyatt et al. 1991). The resulting inventory estimated methane emissions as:
Methane output = livestock number x intake x emission per kg of intake
To implement this, the commissioned study used national statistics on livestock populations together with a livestock population model to estimate the number of animals in sub-categories of each type of ruminant on a monthly time-step by accounting for births, deaths, the month of slaughter and age. Feed intake was estimated for four separate regions of the country to account for differences in pasture quality in different climatic regions (defined on the basis of temperature and rainfall distribution) and for three pasture types within each region (i.e., improved, unimproved, tussock). Published and unpublished data and expert opinion were used to characterize the energy density and chemical composition of the diet consumed in each month by each sub-category of livestock. Dry matter intake was estimated on the basis of energy requirements and the data on diet quality. Methane emissions per unit of dry matter intake were then estimated using a theoretical model of rumen digestion (Baldwin et al. 1987).
When the inventory model developed by Ulyatt et al. (1991) was incorporated into the national GHG inventory, however, a simplified approach was used in which:
methane output = livestock number x methane emission factor
where the methane emission factor was taken from the study by Ulyatt et al. (1991). Thus, while the Ulyatt et al. (1991) method was a Tier 2 approach, the national inventory used a Tier 1 approach with a country-specific emission factor that remained fixed over time.
In 2001, a review was commissioned to assess the conformity of the inventory approach to the IPCC 1996 Guidelines and to suggest recommendations for improving the inventory. The main findings of the review (Clark, 2001) included the following:
- Use of a fixed emission factor resulted in underestimation of emissions, because changes in animal performance were not reflected in the emission factor. A comparison for 1998 of the official inventory estimates and an inventory using methane emission factors adjusted for productivity gains indicated underestimation by official inventory by about 7%.
- The Baldwin model gave estimates of methane output per unit of feed intake of around 7.5% of gross energy, compared to 6% of gross energy for country-specific experimental data and the IPCC default value.
- The contribution to accuracy of dividing the country into climatic regions was limited, whereas if the country were divided into regions based on industry definitions, animal performance data would be readily available and could be more frequently updated.
- Areas of non-conformity with the IPCC Guidelines included the use of a Tier 1 approach in the national inventory when livestock emissions were among the key source categories; lack of transparent documentation of the inventory methods used; and lack of uncertainty analysis.
(2) 2003 2008: developing and implementing a Tier 2 Tier 3 approach
Following the 2001 review, a revised inventory model was developed that differed from the former approach in five main respects:
(i) The revised model did not use fixed emission factors but calculated emissions using a monthly time step model containing data on livestock numbers, livestock performance and diet quality.
(ii) The input data on livestock performance characteristics change each year in line with published industry and government information, thus accounting for changes in livestock productivity.
(iii) Data on direct measurements of methane emissions from ruminants collected in New Zealand were used to estimate the conversion of energy intake to methane output.
(iv) The size of the errors in the inventory were assessed using Monte Carlo analysis; and
(v) The inventory method was transparently documented (Clark et al. 2003).
The overall approach is summarized in Figure 1.
Figure 1: Overall approach in New Zealand’s revised Tier 2 inventory approach
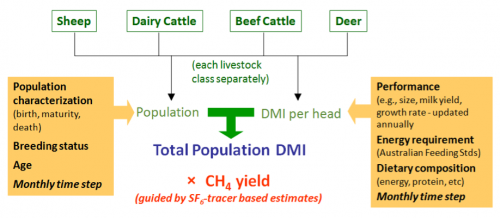
Source: NIR (2007)
For each type of ruminant (dairy cattle, beef cattle, sheep and deer), a population model incorporating births, deaths and slaughter, was developed to estimate the number of animals in each sub-category, including numbers of pregnant and lactating animals on a monthly basis. Livestock productivity data was used along with a model of energy requirements and data on dietary composition of forage and feed to estimate monthly dry matter intake per head for each sub-category of animal. Because of a lack of routine representative surveys in the country, the best available data was used. The same data sources were used in each year, so that even though there are uncertainties around the values used each year, the uncertainties are likely to be consistent, and a time series that reflects changing farming practices is provided. Data sources and values were transparently documented, so that the values used could be incrementally improved over time.
To estimate DMI for each sub-category, the energy required to meet the assumed levels of performance (MJ metabolisable energy (ME) per day) was divided by the energy concentration of the diet consumed (MJ ME per kg dry matter). To estimate energy requirements, an Australian model (CSIRO 1990) was used in preference to IPCC or other models because the Australian model had been developed specifically for grazing animals, which more closely reflects New Zealand’s predominant production practices. Monthly data on the ME value of forage from scientific publications was entered into the model, assuming the same monthly values for all years, as there was no historical time series.
To convert energy intake into methane output, none of the existing published models were judged to be appropriate. However, since 1996 SF6 tracer techniques had been used to measure methane emissions in New Zealand, and by 2003 New Zealand had one of the largest datasets of methane emission measurements under grazing conditions. For the initial revised inventory, the averages of existing published and unpublished measurements for different types of animal were used.
Using the revised inventory model, enteric fermentation emissions were estimated for 1990-2000. The estimate for 1990 submitted in NIR 2003 was 47% lower than in the previously submitted inventory estimates for that year (Figure 2). And while the previous inventory had shown a decreasing trend in total enteric fermentation emissions, the revised inventory showed a lower, but increasing trend. The resulting re-estimate of the trend in enteric fermentation emissions was of great significance, as at that time New Zealand was preparing for the first commitment period of the Kyoto Protocol.
Figure 2: Trend in enteric fermentation emissions (1990-2000) using the initial and revised inventory approaches
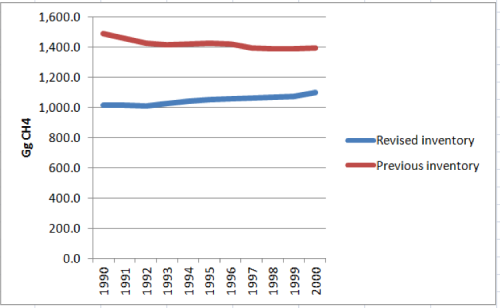
Source: NIR 2003
(3) 2009 present: continuous improvement of Tier 2 Tier 3 approach
Since 2009, the structure and overall approach used in the national inventory has largely remained unchanged. Improvements have focused on improving the accuracy of inventory estimates, improvements in operational efficiency, and improvements in inventory quality. To facilitate regularization of the continual improvement process, in 2009 an Agricultural Inventory Advisory Panel was established consisting of representatives of the Ministry for Primary Industries (MPI) and Ministry for the Environment, which together are responsible for the inventory compilation and reporting; research institutes; and experts on methane and nitrous oxide emissions. The panel provides advice on proposed changes to the agricultural section of the national GHG inventory on the basis of peer reviewed reports and papers (see Inventory Practice: New Zealand Advisory Panel).
For livestock emission sources in the inventory, significant changes have included the following: (1)
Regionalization of dairy sector emissions: Before 2010, CH4 and N2O emissions from ruminants were disaggregated by species and sub-categories of animal based on age and breeding status but not by region. This was because (a) the 2001 inventory review (Clark, 2001) indicated that disaggregating the inventory by climatic region led to identical results to a simpler national model; and (b) some key data (e.g. animal weight, animal performance) was not available on a regional level for all species. However, for dairy cattle, a time series of regionally disaggregated data on dairy cattle populations, live weight, milk yield and milk fat and protein contents were available. Moreover, emissions from the dairy sector had increased from 25% of total agricultural emissions in 1990 to almost 40% of agricultural emissions in 2006, and the regional structure of the sector had changed considerably, suggesting that a single national model may no longer be the most accurate way of estimating GHG emissions from the sector. A comparison of national emission estimates based on a single national model and the aggregation of 17 sub-national estimates indicated that a regional approach has little impact on 1990 emission estimates but reduced estimates for 2006 by 2.3%. The regionalized approach for the dairy sector was adopted in NIR 2010.
Improvements in animal live weight estimates: New Zealand’s methane emissions model estimates emissions on the basis of estimated energy and feed intakes. Since most energy consumed by breeding animals is used for maintenance, animal live weight is closely related to energy and feed intake estimates. Feed intake is estimated on the basis of live weight, but estimation of live weight in the inventory model is done using data on carcass weight and an assumed carcass ratio (i.e. dressing out percentage). A review of the national inventory model (Muir et al. 2008) suggested that the ewe and beef cow carcass or live weight estimates and carcass ratios used in the model were based on limited data and assumptions that might lead to significant errors in the inventory estimates. A review of the best available published and unpublished data and collection of new primary data led to a revision of the time series for live weight estimates for ewes and beef cows. (See Inventory Practice: Improved Estimates of Live Weight in New Zealand).
Adjustments to animal population models: Data on the total population of each livestock type in New Zealand is available, but the inventory uses a population model to estimate the change in the populations of sub-categories of each type based on age and breeding status. The estimated sub-populations are not directly verifiable. Therefore it is important to check the suitability of the assumptions used in the model. A review of the population model was commissioned, which led to recommendations to revise various assumptions, such as the dates of lambing calving and slaughter for certain sub-categories, mortality rates and average age at slaughter. These adjustments were recommended on the basis of the best available data. In addition, improvements have been made to the software used for inventory compilation and to the procedures for error checking and recalculation.
These adjustments and the resulting recalculations have led to marginal changes in estimated total emissions (Figure 3).
Figure 3: Comparison of total enteric fermentation emissions in NIR 2016 submission and previous submissions
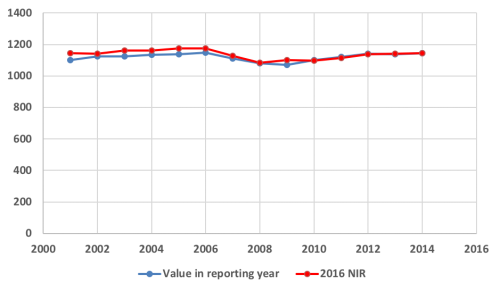
Source: H. Clark (2018)
Manure management (Methane)
Manure management methane emissions from dairy cattle are a key category in the national inventory (NIR 2017).
Approach used: Because most livestock production in the country is grazing-based, whereas other approaches are more suited to systems involving storage of manure since 2006 a country-specific approach to estimating manure management methane emissions has been used. Since NIR 2015, for methane from dairy effluent in anaerobic lagoons, the equations in the IPCC 2006 Guidelines have been used.
Description of approach: The country-specific approach is based on methods recommended by Saggar et al. (2003) in a review commissioned by the Ministry of Agriculture and Forestry. The approach involves:
1. estimating the total quantity of excreta produced,
2. partitioning the excreta between that deposited directly onto pastures and that stored in anaerobic lagoons; and
3. applying country-specific emission factors for the quantity of methane produced per unit of faecal dry matter produced.
Faecal dry matter output is calculated monthly for each species subcategory as:
FDM = DMI × (1-DMD)
Where:
FDM = faecal dry matter output
DMI = dry matter intake
DMD = dry matter digestibility
DMI and DMD are the same as in the enteric methane inventory, and:
M = (FDM × MMS) × Ym
where:
M = methane from manure management
FDM = faecal dry matter output
MMS = proportion of faecal material deposited on pasture
Ym = country specific methane yield methane yield (g CH4 per year)
95 % of excreta from dairy cattle and all excreta from other ruminants is deposited directly on pastures. Values for Ym for excreta deposited on pastures for sheep and cattle are obtained from country-specific measurement studies. For deer, there have been no specific measurements, so the mean of cattle and sheep values is used. As improvements in the national inventory have been implemented (e.g. changes in livestock performance parameters, regionalization of the dairy inventory), these changes have been incorporated into the data used to estimate manure management methane emissions.
Only 5% of dairy cattle manure is stored in anaerobic lagoon waste systems, for which the method adopted from 2006-2015 was as follows:
M = (FDM × MMS) × W/1000/d × Ym
Where:
M = methane from manure management
MMS = proportion of faecal material deposited on pasture
W = water dilution rate (litres per kg faecal dry matter)
d = average depth of a lagoon (metres)
Ym = methane yield (g CH4 per m2 per year)
The method adopted assumed that all faeces deposited in lagoons are diluted with 90 litres of water per kilogram of dung dry matter, which gives the total volume of effluent stored (NIR 2008). Published reports estimated annual CH4 emissions as 0.33–6.21 kg CH4/m2/year from anaerobic lagoons in New Zealand, and the mean value is assumed in the inventory. From NIR 2015, this method was replaced by the IPCC 2006 Tier 2 equations in response to criticism of the country-specific methodology in scientific papers published by New Zealand researchers and a review commissioned by MPI (Pratt et al. 2012).
Uncertainty management
Prior to revision of the inventory approach in 2003, New Zealand’s inventory submissions did not provide a quantitative estimate of uncertainty. Uncertainty assessment was conducted as part of revision of the livestock inventory, and was reported in the 2003 NIR submission. The assessment used Monte Carlo analysis to assess the uncertainties in predicted outputs (i.e. dry matter intake and methane emissions) and to determine confidence intervals around the estimated output values. This analysis was implemented in a specialized software package, @RISK. In Monte Carlo analysis, input parameters that are subject to uncertainty (in this case, energy intake, energy concentration in the diet, the quantity of methane produced per unit of intake and the number of animals) are described as probability distributions rather than single values. The model is then run thousands of times, with a new value for each input parameter sampled from within its probability distribution. The resulting estimated emissions thus reflect the range of assumed variability in the input parameters. The contribution of each input parameter to uncertainty in the output estimates is then quantified using regression analysis.
Initially, analysis was applied to the inventory years 1990 and 1998. Results estimated uncertainty in methane emissions of 23.5% (Clark et al. 2003). It also showed that the 95% confidence intervals for 1990 and all subsequent years overlap, so that from a statistical perspective, it was not certain that emissions had actually changed since 1990. Analysis also showed that uncertainty in methane emissions was dominated by the uncertainty in the methane per unit of intake, with smaller contributions from uncertainties in the estimates of energy requirements and pasture quality. Therefore, reducing uncertainties in methane emissions per unit of intake would have the greatest contribution to reducing uncertainty in the overall livestock methane inventory.
In subsequent years, the uncertainty of the annual estimate was calculated using the 95% confidence interval from the Monte Carlo simulation as a percentage of the mean value, i.e. in 2001, the uncertainty in annual emissions was ± 53% (Table 2). The uncertainty in annual estimated livestock methane emissions was about 12% of total national emissions, and was the largest source of uncertainty in the whole inventory. However, assuming that uncertainty between years is correlated, the contribution of livestock methane emissions to uncertainty in the trend in emissions was only about 2.4%.
Table 2: Uncertainty in the annual estimate of enteric fermentation emissions for 1990, 2001 and 2005 estimated using Monte Carlo simulation (1990, 2001) and the 95% confidence interval (2005)
| Enteric methane emissions (Gg/year) | 95% CI minimum | 95% CI maximum | |
|---|---|---|---|
| 1990 | 1015.5 | 478.1 | 1552.9 |
| 2001 | 1099.4 | 517.6 | 1681.2 |
| 2005 | 1139.0 | 536.2 | 1741.8 |
Source: NIR 2007
In 2009, the Ministry of Agriculture and Forestry commissioned a new study to recalculate the uncertainty of the enteric fermentation methane emissions for sheep and cattle (Kelliher et al. 2009). Since the uncertainty analysis in 2003, a larger number of experimental estimates of feed intake and methane yield was available (529 in 2009, compared to 50 used in the 2003 analysis), providing an opportunity to re-estimate uncertainty in the inventory. In addition to estimating uncertainty in total methane emissions, the study also addressed other questions, such as the relationship between age of sheep or cattle and methane yield. It concluded that there were no statistically significant differences between methane yields of sheep or cattle of different ages, and estimated the number of additional methane yield experiments and measurements that would be required to reduce uncertainty in the livestock methane inventory by 1%. Overall uncertainty in the livestock methane inventory was estimated at 16%. Thus, uncertainty analysis contributed not only to producing a new estimate of total uncertainty in the inventory, but also improvements in methods for uncertainty analysis, providing guidance on input data values, and support to refining future inventory improvement activities.
(1) Clark. 2018. Key steps and requirements in moving to an advanced inventory: Experience from New Zealand.
Further Resources
NIR 2003 New Zealand’s Greenhouse Gas Inventory 1990-2001. Ministry of Environment.
NIR 2007 New Zealand’s Greenhouse Gas Inventory 1990-2005. Ministry of Environment.
NIR 2008 New Zealand’s Greenhouse Gas Inventory 1990-2006. Ministry of Environment.
NIR 2017 New Zealand’s Greenhouse Gas Inventory 1990-2015. Ministry of Environment.
Baldwin et al. 1987. Metabolism of the Lactating Cow. ll Digestive Elements of a Mechanistic Model. Journal of Dairy Research, 54: 107-131
Clark H. 2001. Ruminant Methane Emissions: a Review of the Methodology used for National Inventory Estimations. A Report Prepared for the Ministry of Agriculture and Forestry by AgResearch Ltd.
Clark et al. 2003. Enteric methane emissions from New Zealand ruminants 1990–2001 calculated using an IPCC Tier 2 approach. Report prepared for the Ministry of Agriculture and Forestry.
Clark. 2018. Key steps and requirements in moving to an advanced inventory: Experience from New Zealand. PowerPoint presentation.
CSIRO. 1990. Feeding Standards for Australian Livestock: Ruminants. Australian Agricultural Council. Ruminants Sub Committee. CSIRO Publications, East Melbourne, Australia.
Kelliher, et al. 2009. Reducing uncertainty of the enteric methane emissions inventory. MAF Technical Paper. [Download]
Muir, et al. 2008. Better estimation of national ewe and beef cow liveweights. MAF Technical Paper. [Download]
Pratt C, et al. 2012. Revised methane emission factors and parameters for dairy effluent ponds – Final Report. Landcare Research.
Saggar S, et al. 2003. Methane emissions from animal dung and waste management systems, and its contribution to national budget. Landcare Research Contract Report: LC0301/02. Prepared for the Ministry of Agriculture and Forestry: New Zealand.
Ulyatt MJ, et al. 1991. Methane Production by Ruminants. A Report Prepared for the Ministry of the Environment by DSIR Grasslands, June 1991.
Author: Andreas Wilkes, Values for development Ltd (2019)