

Overview of The Netherlands‘ current Tier 3 and 2 approach
The Netherlands has a strong history in agriculture. Livestock (dairy, swine and poultry), horticulture and arable farming are still major sub-sectors in the country’s economy. Key categories in the country’s latest inventory include enteric fermentation from dairy cattle, growing cattle and swine. For manure management, methane emissions from cattle, swine and poultry, and N2O emissions from manure management (direct and indirect following atmospheric deposition of NH3 and NOx) are key sources. In the Netherlands, methane emissions from enteric fermentation are primarily caused by cattle (89%), followed by swine (6%) and other livestock categories (sheep, goats and horses, 5%).
A country-specific Tier 3 approach is used for enteric fermentation emissions from dairy cattle. A country-specific Tier 2 approach is used for growing and non-dairy cattle, while for all other livestock categories a Tier 1 approach is used and default IPCC emission factors are applied.
Table 1: Tiered approaches used for livestock in the national GHG inventory
| Livestock types | Tier used for enteric fermentation (CH4) | Year adopted* | Tier used for manure management (CH4) | Year adopted* |
|---|---|---|---|---|
| Dairy cattle | T3 | 2006 | T2 | Before 2003 |
| Growing cattle | T2 | Before 2003 | T2 | Before 2003 |
| Non-dairy cattle | T2 | Before 2003 | T2 | Before 2003 |
| Poultry | NE | Before 2003 | T2 | Before 2003 |
| Pigs | T1 | Before 2003 | T2 | Before 2003 |
| Other livestock categories | T1 | Before 2003 | T1 | Before 2003 |
*Year refers to the year of NIR submission, NE=not estimated
Livestock population data originate from the yearly Agricultural census. The census distinguishes a number of livestock categories (Table 2).
Table 2: Livestock categorization method
| Mature dairy cattle | 2 categories based on region within The Netherlands (Northwest/Southeast) |
|---|---|
| Mature non-dairy cattle | 1 category |
| Growing cattle | 14 categories based on production purpose (replacement or fattening) and age |
| Swine | 6 categories based on age and physiological status |
| Poultry | 9 categories differentiated by production purpose (laying hen or broiler) and age |
| Sheep | 2 categories: ewes and other |
| Goats | 2 categories: milk goats and other |
| Horses | 4 categories: horses and ponies for agriculture or private use |
| Other animals | Mules and asses, rabbits (does/meat), minks and foxes |
Source: Vonk et al. 2018
Enteric fermentation emissions from cattle
A Tier 3 approach for mature dairy cattle uses a mechanistic, dynamic model representing fermentation mechanisms in the rumen. Rather than assuming rumen CH4 production, the model predicts CH4 production based on the effect of nutrition on microbial activity, volatile fatty acid (VFA) production and hydrogen surplus. By estimating methane production directly, the model clearly differentiates from other model approaches and calculation methods, and from the Tier 2 approach which uses a fixed methane conversion factor (Figure 1).
The model calculates (i) gross energy (GE) intake, (ii) CH4 EF (in kg CH4/cow/year) and (iii) the methane conversion factor (Ym; % of GE intake converted into CH4) on the basis of data on:
- The share of feed components (grass silage, maize silage, wet by-products and concentrates);
- the chemical composition of feed components (soluble carbohydrates (including sugars), starch, cell walls (hemi-cellulose, cellulose and lignin), crude protein, crude fat and crude ash);
- rumen intrinsic degradation characteristics of starch, crude protein and fibre.
Due to differences in rations between the Northwest (rations mainly grass-based) and Southeast of the country (large share of maize silage) calculations for these regions are made separately.
Figure 1. Schematic representation of the difference between Tier 2 and Tier 3 approaches (MCF = Methane Conversion Factor, MEF = Methane Emission Factor)
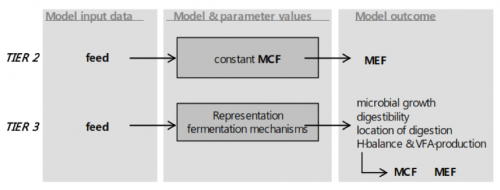
Source: Bannink 2011
For other mature cattle and growing cattle categories, enteric fermentation emissions are calculated by multiplying the gross energy intake with a methane conversion factor (Ym). As the production of white veal calves is an important sub-sector in The Netherlands, and considering the large share of milk products in their ration, in this case a country-specific Ym value is used. For all other cattle types (young cattle and mature non-dairy cattle) the IPCC 2006 default Ym is used.
Gross energy intake is based on rations calculated by the Working Group on Uniformity of calculations of Manure and Mineral data (in Dutch ‘Werkgroep Uniformering berekening Mest- en mineralencijfers’, WUM). Changes in GE intake are based on changes in both the total feed intake and the share of feed components.
Since 1990, there have been continuous increases in feed intake (20%), level of milk production (34%) and CH4 emission (17%), resulting in a continued reduction of CH4 per kg of fat- and protein-corrected milk (13%) (Bannink 2011). An increase in total feed intake has increased the emission factor over time, however a change in nutrient composition, contributing to (among others) feed digestibility has partly offset the increase in emission factor. An overview of emission factors for methane emissions from enteric fermentation is provided in Figure 2.
Figure 2. Methane emission factors for cattle (1990-2015)
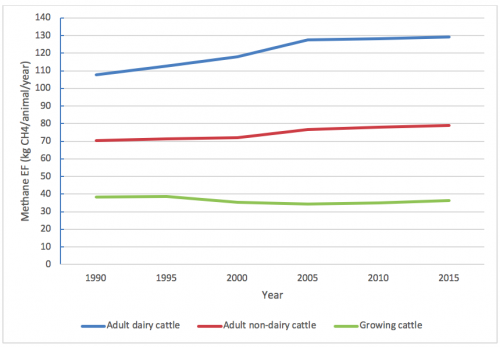
Source: Netherlands NIR 2017
Inventory compilation
The following data is collected:
- the number of dairy cows;
- registered national milk production;
- a weighed yearly average of feed intake;
- a weighed yearly average of diet composition;
- data on feed analysis and chemical composition of forages, and the composition of concentrates feeds.
Data on nutrition and dairy performance are delivered by the Working Group on Uniformity of calculations of Manure and Mineral data (WUM) on a yearly basis. Data is collected and aggregated by a team under the coordination of Statistics Netherlands (CBS).
Data on the chemical composition of roughages (grass herbage, grass silage, maize silage) are provided by Eurofins Agro, the main commercial laboratory for such in The Netherlands. The chemical composition of roughages from many farms is analysed as part of the Dutch manure policy; farmers in The Netherlands are obliged to demonstrate the mineral management on their farm, including the composition of their roughages (through fixed amounts or by analysis).
Data on the type, amount and chemical composition of by-products and concentrates fed to dairy cattle are collected by CBS by consultation with the feed industry and use of feed tables.
How the approach has developed over time: from Tier 2 to Tier 3 (2006)
The Netherlands began using a country-specific Tier 3 approach for dairy cattle in 2006 to be able to justify a lower CH4 conversion factor than the average default value with the relatively high nutritional quality of Dutch dairy diets. At that time, the IPCC guidelines for a Tier 2 approach applied a default CH4 conversion factor of 6.5% of gross energy (GE) intake. This value appeared relatively high for Dutch conditions. Furthermore, using a constant conversion factor did not reflect variation in level of feed intake, feed digestibility and the composition and quality of the ration. A dynamic, mechanistic model to account for this variation was available already (Mills et al., 2001) and was adapted with an improved representation of the production of volatile fatty acids (Bannink et al. 2000; 2006); a crucial element for prediction of hydrogen balance and CH4 formation. Therefore, the Netherlands revised its method in 2005 by using this dynamic, mechanistic model as a country-specific Tier 3 approach from 2006 onwards.
The model is derived from the rumen fermentation model developed by Dijkstra et al. (1992) and extensively evaluated by Neal et al. (1992) and Bannink et al. (1997). The model, initially developed to model the fermentation process in the rumen, appeared to be suitable for methane modeling as well, and offered the opportunity to take more detailed ration composition and quality into account. The model thus enabled more precise methane emission estimations; each aspect of the model is based on scientific research. Evaluation studies by Neal et al. (1992) and Bannink et al. (1997) indicated the need to revise the representation of the amount and type of VFA as end-product of rumen fermentation. Subsequently, a database of in vivo data from lactating cows was developed and analyzed by Bannink et al. (2000; 2006). Mills et al. (2001) adapted the model by adding coefficients for digestion in the small intestine and a mechanistic, adding a dynamic, mechanistic module for microbial activity in the large intestine, and adding calculation of hydrogen balance in rumen and large intestine and CH4 formation. An updated version with a representation of VFA formation that is dependent on digesta acidity, applied as a Tier 3 approach was described by Bannink et al. (2011).
Revised feed intake, milk production and ration composition data for the years 1990 until 2007 (2009)
In 2009 revisions were made to derive input data on feed intake, ration composition and milk production figures from 1990 until 2007. Revisions included (i) inclusion of feed losses (of roughages, concentrates and by-products), (ii) an increase of the net energy requirement for maintenance and (iii) a correction for the ammonia-N fraction of N in crude protein (Bannink, 2011). Calculations of the methane emissions from enteric fermentation from dairy cows were subsequently revised. Results of the corrections are displayed in Figure 3.
In 2016, a slight modification was introduced to let the model apparent fecal N digestibility and excretion urine or ammoniacal N more accurately. This modification had negligible effects on predicted CH4 emissions however (a 0.03% higher CH4 emission factor; results not shown).
Figure 3. Recalculated methane EF for dairy cattle with revised input data
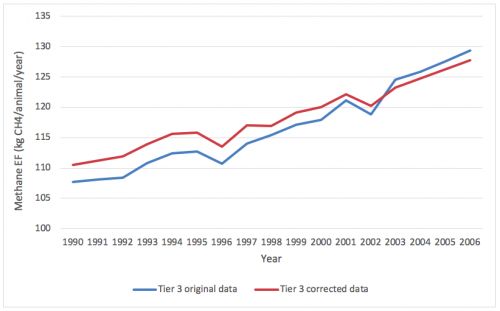
Source: adapted from Bannink 2011
Methane emissions from manure management
Manure management methane emissions from cattle, swine and poultry are a key category in the national inventory (NIR) and calculated using a country-specific Tier 2 approach. Methane emissions from manure are mainly caused by fermentation of organic matter in an anaerobic environment. As methanogenic bacteria take some time to produce methane, methane from manure stored for less than a month is very low. The conversion of organic matter in methane also depends on manure composition and environmental factors such as temperature. Methane emissions are calculated for liquid and solid manure management systems and, where applicable, also for manure produced on pasture land whilst grazing.
Manure management methane emission estimates are directly related to calculations done for methane emissions from enteric fermentation, as key input data consist of the amount of volatile solids (VS) produced per animal, which are again based on feed intake, composition and VS digestibility. The amount of volatile solids excreted by livestock depends on the digestibility of the organic matter and protein content of the feed. Data on feedstuffs and rations are used to provide this information (Zom & Groenestein, 2015).
Manure management methane emissions are calculated by multiplying the volatile solids excretion (VS, in kg) with the maximum methane production potential (BO, in m3 CH4/kg VS) and the methane conversion factor, which is based on the manure management conditions.
For all other livestock categories emissions are estimated using a Tier 1 approach (Vonk et al. 2018).
Uncertainty management
The uncertainty for each aspect of the rumen fermentation model used to calculate methane emissions from enteric fermentation, is estimated by experts. Since revisions to derive input data were done in 2009, and calculations were corrected in 2011, the estimated uncertainty for annual emissions from dairy cattle was corrected from 20 to 16%.
Until 2017, a 5% uncertainty level for livestock population data was used, while for the emission factor an uncertainty level of 15% was employed (combining to 16% overall uncertainty).
In the recently published update of the methodology for estimating emissions from agriculture in The Netherlands, a revised uncertainty level for mature dairy cattle of 15% is described, based on a new estimate of uncertainty of 2% for the total animal population. Furthermore, uncertainty levels are disaggregated for the Northwest and Southeast of The Netherlands, with an uncertainty of 21% for the split emission factor, and 3.4 and 2.4% for the activity data, respectively.
For other mature cattle, growing cattle, swine and other livestock categories, uncertainty levels are 21, 11, 41 and 44.5% respectively (Vonk et al. 2018).
Further Resources
Bannink A. 2011. Methane emissions from enteric fermentation by dairy cows, 1990-2008; Background document on the calculation method and uncertainty analysis for the Dutch National Inventory Report on Greenhouse Gas Emissions. Wageningen, Statutory Research Tasks Unit for Nature and the Environment.
Bannink A, van Schijndel MW, Dijkstra J. 2011. A Model of Enteric Fermentation in Dairy Cows to Estimate Methane Emission for the Dutch National Inventory Report Using the IPCC Tier 3 Approach. Animal Feed Science and Technology.
Bannink A, De Visser H, Van Vuuren AM. 1997. Comparison and evaluation of mechanistic rumen models. British Journal of Nutrition.
Dijkstra J, Neal HD StC, Beever DE, France J. 1992. Simulation of nutrient digestion, absorption and outflow in the rumen: model description. Journal of Nutrition.
Mills JAN, Dijkstra J, Bannink A, Cammell SB, Kebreab E, France J. 2001. A mechanistic model of whole-tract digestion and methanogenesis in the lactating dairy cow: model development, evaluation, and application. Journal of Animal Science.
Neal HD StC, Dijkstra J, Gill M. 1992. Simulation of nutrient digestion, absorption and outflow in the rumen: model evaluation. Journal of Nutrition.
NIR. 2017. Greenhouse gas emissions in The Netherlands 1990 2015 National Inventory Report 2017. RIVM Report 2017-0033.
Vonk J, et al. 2018. Methodology for estimating emissions from agriculture in the Netherlands update 2018. Calculations of CH4, NH3, N2O, NOx, PM10, PM2.5 and CO2 with the National Emission Model for Agriculture (NEMA). Wageningen, The Statutory Research Tasks Unit for Nature and the Environment (WOT Natuur & Milieu). WOt-technical report.
Zom RLG and Groenestein CM. 2015. Excretion of volatile solids by livestock to calculate methane production from manure. TC-O_20. In: RAMIRAN 2015 16th International Conference Rural-Urban Symbiosis. Proceedings Book. 8th 10th September 2015, Hamburg University of Technology, Germany.
Author: Andreas Wilkes, Values for development Ltd (2019)