Inventory practice: Institutional arrangements for data supply in Denmark’s inventory

Keywords: Institutional arrangements

What data needs were addressed? Institutional arrangements for data collection, exchange and collaboration.

Why was the data needed? Compilation of input data for the annual inventory.

Methods used: Close cooperation between statistics, research institutes and advisory services.

How did the data need to be addressed? Both the Danish Centre for Environment and Energy (DCE) and Aarhus University have established data agreements (MOUs) with institutes and organizations (see table below) to ensure required input data is annually available to prepare the emission inventory. SEGES, the central office for all Danish agricultural advisory services, shares data with DCE and Aarhus University, who update the input data in the Integrated Database Model (see Inventory practice: Integrated data management in Denmark) annually.

The cooperation between research and advisory services is of mutual benefit: it enables researchers to access actual and high-quality data, whilst it enables advisory services to have actual core data to its disposal for high-quality services and the provision of benchmarks to their farmers.

InstituteKey data/information collected
Statistics Denmark Agricultural Statistics• Livestock production
• Milk yields
• Slaughtering data
• Export of live animals poultry
• Land use
• Crop production
• Crop yields
Danish Centre for Food and Agriculture (DCA), Aarhus University• N-Excretion
• Feeding plans
• Animal growth
• Use of straw for bedding
• N-content in crops
• Modeling of data regarding N-leaching/runoff
• NH3 emission factor
SEGES• Housing type (until 2004)
• Grazing situation
• Manure application time and methods
• Estimation of extent of field burning of agricultural residues
• Acidification of slurry

Author: Andreas Wilkes, Values for development Ltd (2019)

Inventory practice: Institutional arrangements for compilation of Austria’s livestock emissions inventory

Keywords: Institutional arrangements | planning

Country context: Austria’s inventory approach for Tier 2 estimation of cattle emissions uses prior research to establish relationships between gross energy intake and animal performance parameters. For dairy cattle, a relationship between milk yield and gross energy intake has been established, and for other cattle, gross energy intake of different sub-categories has been established based on animal performance and typical feed characteristics. Using this prior research, compilation of the annual inventory only requires data on animal population numbers in each category and milk yield. See Country Inventory Case Study: Austria.

Institutional arrangements: The Federal Ministry of Agriculture, Forestry, Environment and Water Management (BMLFUW) is responsible for Austria’s reporting obligations. It has established an Inspection Body for Emission Inventories (IBE) that compiles the annual GHG inventory. The personnel of the IBE are made up of staff from various units of the ministry. For each inventory sector, two experts form a sector team. These experts collect activity data, emission factors and all relevant information needed for finally estimating emissions. The sector experts are also responsible for the choice of methods, data processing and archiving and for contracting studies, if needed. As part of the quality management system the Head of the IBE approves methodological choices. Before methodologies are applied the methodology is defined as a SOP (standard operating procedure) together with a template for calculating emissions, where needed. The SOP is checked for applicability and completeness of information needed and finally approved by the head of the inspection body. New and changed calculation files are validated before use. Once data has been collected, it is entered together with emission estimates into a centralized database, where data sources are well documented for future reconstruction of the inventory. The sector experts are also responsible for QA/QC activities.

For livestock emissions, data comes from prior national studies and annual data on livestock population and milk yields reported by Statistics Austria. Provision of this data is part of the legal mandate of Statistics Austria.

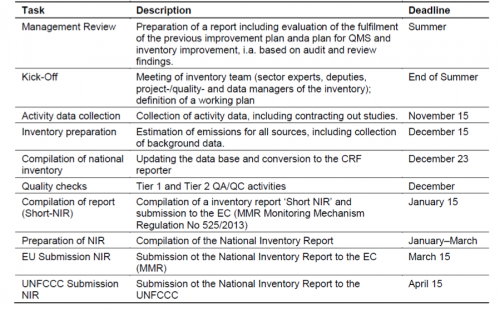
Inventory compilation process: Austria’s inventory is compiled in accordance with an annual plan (Table 1). Annual planning begins with sectoral improvement planning, in which the sector team discusses all issues related to the sector with the head of IBE, assesses all issues according to their urgency and resource needs, and finally agrees on measures and activities to implement. Following this, a management review meeting is held at which the previous year’s activities and performance are reviewed, including quality management activities, and measures are set for improving the management system and its processes, including plans for internal audits, QA and verification activities as well as training and resource plans.

Table 1: Overview of inventory related tasks


Furhter Resources

Austria (2017) National Inventory Report.


Author: Andreas Wilkes, Values for development Ltd (2019)

Inventory practice: Operational planning for a Tier 2 inventory in Kenya

Keywords: planning | dairy cattle | NAMA

What needs were addressed? Kenya has been developing a nationally appropriate mitigation action (NAMA) in the dairy sector. Quantification of the resulting emission reductions will use a Tier 2 approach. However, the national inventory and the projected scenarios underlying Kenya’s national climate change action plan and NDC use a Tier 1 approach, which cannot reflect the effects of productivity increases due to NAMA implementation. Therefore, the State Department of Livestock decided to initiate a process of consultation and planning for the development of a Tier 2 approach for the national GHG inventory.

How were the needs addressed? In early 2018, the State Department of Livestock (SDL), with support from FAO and GRA, convened a consultation meeting. Participants from the Ministry of Environment, national statistical agencies and dairy sector stakeholders agreed on the necessity for adopting a Tier 2 approach for dairy cattle in the national inventory. In June 2018, a further workshop was convened, attended by representatives of the Climate Change Directorate (CCD) which is responsible for the inventory, other government agencies as well as dairy sector technical specialists. The workshop provided training in the technical requirements for a Tier 2 inventory, outlined an overall structure for the inventory, and assessed the availability of the data required. One key outcome of the workshop was an outline action plan for delivering a draft inventory by December 2018, for validation and inclusion in the next UNFCCC submission by February 2019. Table 1 presents a summary of the action plan discussed. Specific dates, resources required and individuals involved have yet to be confirmed.

Table 1: Outline action plan for developing a Tier 2 inventory for dairy in Kenya

What to doWho’s responsible involvedNotes
1Form initial ‘core team’SDL + others tbc
2Appoint ‘project manager’SDL + others tbcManager is needed to make sure work proceeds continually
3Make work planCore team
4Agree Structure of inventoryCore team
5Define data needsCore teamIncl. data needs and formats required
6Develop spreadsheet/softwareCore team
7Consultation on members of inventory teamSDL lead consultation
8Training on IPCC Tier 2 model & inventory compilation for inventory team
9Identify data sources providersInventory team
10Collate dataInventory teamIncl. literature review
11Analyse dataInventory teamStatistical support needed?
12Agree activity data & MCF values to useInventory teamEngage with ag statistics committees to ensure consistency
13Document all data sources and values chosenInventory team
14Input data into softwareInventory team
15Analyze/assess initial resultsInventory team
16Assess gaps/limitations, propose priority improvementsInventory team
17QA/QC checking for mistakes etcInventory team
18QC by experts from the sectorSDL lead
19QA to check against other countries’ figuresCCD experts
20Stakeholder review of initial resultstbc
21Revise draftInventory team
22Submit to CCDSDL
23External reviewCCD

Further Resources

Kenya NCCAP

Kenya INDC.

Kenya Dairy NAMA.

FAO & New Zealand Agricultural Greenhouse Gas Research Centre. 2017. Options for low emission development in the Kenya dairy sector reducing enteric methane for food security and livelihoods. Rome. 43 pp.


Author: Andreas Wilkes, Values for development Ltd (2019)

Livestock inventory practice: Aligning national GHG inventories, NDCs and NAMAs in Kenya

Keywords: mitigation policy | dairy cattle | NAMA

What needs are being addressed? Climate policy is a rapidly developing area. Elaboration of national policies, international commitments and sub-national actions often takes place in parallel. Kenya’s experience shows the important role that improvements in the national GHG inventory can play in aligning the measurement, reporting and verification (MRV) of initiatives at national and sub-national level, as well as alignment with accounting for the NDC at international level.

Linking NAMAs and NDCs: Kenya’s National Climate Change Action Plan (NCCAP) is the guiding document for climate-related policies and measures in Kenya. In order to identify opportunities and priorities for GHG mitigation, the NCCAP described a ‘reference case‘ or business-as-usual scenario for national GHG emissions to 2030, and highlighted opportunities for reducing national GHG emissions below that scenario. Analysis of mitigation potentials then informed Kenya’s INDC target for mitigation. In some sectors, where prior bottom-up analysis had been conducted, the mitigation opportunities were closely linked to specific policies and measures. For the agriculture sector, a target or reducing emissions by 30% was set, and promising options were identified, but specific measures to achieve that target were not determined.

For livestock emissions, analysis in the NCCAP assumed that the trend in emissions would be a continuation of historical trends in livestock population and a constant Tier 1 emission factor. Bottom-up analysis of mitigation potential in the livestock sector was not available when the NCCAP was being drafted, so the priorities set out in the Action Plan were not informed by specific analysis of livestock sub-sectors. And in any case, quantification of emission reductions would not have been possible using a fixed Tier 1 emission factor.

Kenya’s dairy NAMA began to be developed after the release of the Action Plan. When developing BAU scenarios for the dairy sector, the NACCP was consulted, but because of the limitations of the methods used in the analysis for the NACCP, new scenarios were developed for the dairy NAMA. These scenarios were developed taking Kenya’s Dairy Master Plan (DMP) as a guide, in which per capita milk demand is forecast to double by 2030. A BAU scenario (i.e. the DMP’s target is met with no change in emission intensity), and several mitigation scenarios (i.e. the DMP’s target is met with different trends in emission intensity over time) were produced using a Tier 2 model (GLEAM) that was able to relate scenarios for dairy cattle populations and milk yield to changes in emission factors and emission intensity. The resulting scenarios are closely related to dairy sector policy scenarios, but not to analysis underlying national climate policies. Better alignment of mitigation ambition in the livestock sector with analysis underling the NDC will require that the NDC is informed by analysis using a Tier 2 approach to quantification of livestock emissions.

Linking NAMAs and national GHG inventories: The MRV methodology proposed for Kenya’s dairy NAMA involves establishing a baseline through regional surveys of smallholder dairy farms to collect data needed to estimate emission intensity using a Tier 2 approach in each region. Emission reductions due to changes in emission intensity and yield will be calculated in comparison to this baseline. On this basis, the resulting emission reductions can be reported to the agencies that fund implementation of the NAMA. They can also be reported in the mitigation section of the Biennial Update Report, along with a description of the methodologies and assumptions used in estimating emission reductions. However, because the emission reductions will be achieved through improvements in dairy cow productivity, the resulting changes in emissions per animal would not be reflected in the national GHG inventory. Kenyan stakeholders have thus become aware of the relevance of adopting a Tier 2 approach for dairy cattle in the national GHG inventory.

How are the needs being addressed? In 2018, a national workshop was convened by the State Department of Livestock to discuss with stakeholders their support for beginning the process of adopting a Tier 2 approach for dairy cattle emissions. Stakeholders from livestock, climate, and statistics departments, along with national and international researchers shared information on related initiatives, came to a consensus on the need to adopt a Tier 2 approach, and made suggestions for how this work can be coordinated and the support that would be needed.


Further Resources

Kenya NCCAP

Kenya INDC

Kenya Dairy NAMA

FAO & New Zealand Agricultural Greenhouse Gas Research Centre. 2017. Options for low emission development in the Kenya dairy sector reducing enteric methane for food security and livelihoods. Rome. 43 pp.


Author: Andreas Wilkes, Values for development Ltd (2019)

Inventory practice: The use of the Karoline model to predict methane yield

Keywords: methane conversion factor | modeling | dairy cattle

What data needs were addressed? Prediction of methane yield.

Why was the data needed? To establish a methane conversion factor.

Methods used: Mechanistic model.

How was the data need addressed? The Karoline model is intended to be used by advisory services in Nordic countries including Denmark. The model simulates animal performance (i.e. milk yields) of a given feed in a given situation. The model is a dynamic and mechanistic simulation model for lactating dairy cows, and consists of two ‘sub-models’: one digestion, and one metabolism model. Model inputs include live-weight, week of lactation, rate of dry matter (DM) intake and DM composition. Numerous feed parameters are included as well, including crude protein (CP), crude fat, potentially degradable neutral detergent fibre (NDF), totally indigestible NDF, starch (St), fermentation products and a rest fraction (RF). Model outputs include parameters measuring digestion and nutrient use efficiency (e.g. use of metabolizable energy for lactation), production parameters (milk yield, milk composition, live weight gain), and protein and energy values of the feed ration.

The model can also be applied to quantitative prediction of methane emissions from dairy cows under varying conditions, depending on (i) level feed feeding, (ii) proportion of concentrates in the ration, (iii) digestibility of roughages and (iv) fat, sugar and starch content in the feed. Results from the model are in accordance with experimental data (Ramin & Huhtanen, 2015), hence the model is considered a reliable model for predicting methane emissions from mature dairy cows.


Further Resources

Olesen JE, et al. 2005. Evaluering af mulige tiltag til reduktion af landbrugets metanemissioner. Arbejdsrapport fra Miljøstyrelsen Nr. 11 2005.

Sveinbjrnsson J, et al. 2006. The Nordic Dairy Cow Model Karoline Development of Volatile Fatty Acid Sub-Model. Nutrient digestion and utilization in farm animals: modeling approaches.

Ramin M, Huhtanen P. 2015. Nordic dairy cow model Karoline in predicting methane emissions: 2. Model evaluation. Livestock Science.


Author: Andreas Wilkes, Values for development Ltd (2019)

Livestock inventory practice: Dealing with missing data for livestock characterization in Austria

Keywords: filling data gaps | livestock characterization | interpolation | extrapolation

Country context: Almost all enteric fermentation emissions in Austria are from cattle and Austria uses a Tier 2 approach for both dairy and non-daiary cattle. Since the mid-1990s, after Austria joined the EU, financial support for suckling cows increased (i.e. cattle are primarily raised for veal and beef with the milk of the cow only provided for the suckling calves), especially in mountain areas where the production system contributes to conservation of the traditional landscape. The area under organic production has grown, and now covers about 18% of total farm area in the country.

What data needs were addressed? Distribution of non-dairy cattle between organic and non-organic production systems.

Why was the data needed? Austria’s country-specific enteric fermentation approach estimates GE from the typical dry matter intake (DMI) of cattle (see Austria country case study). Diets vary considerably between organic and non-organic production systems. Thus, it is necessary to estimate how many cattle are raised in organic and non-organic production systems. In Austria’s initial inventory submissions, data on numbers of cattle on organic farms was available from the databases of INVEKOS, the control system used to manage EU subsidy payments. However, for some years the INVEKOS database did not provide a breakdown of the cattle population by sub-category of cattle. Furthermore, the subsidy programs covering cattle later ended and the inventory switched to a new data source on the organic cattle population from the Ministry of Agriculture’s ‘Green Report’. However, this change in data source resulted in missing data for some years not captured in either source. There were data gaps for the years 1990 1996 and for 2001 2003.

Methods used: trend extrapolation, interpolation of available data, expert opinion.

How was the data gap addressed?
For all major animal categories, the average share of organic farming in total agricultural land area in the 1997-2000 period was calculated from the INVEKOS data. This average share was then allocated to all animal sub-categories, assuming also that the cattle in organic and conventional farms have the same herd structures. This provided an estimate of the proportion of organic and non-organic cattle of different types. This structure was applied to the years 1990-1996 by extrapolating a trend in the animal population in organic and conventional farms based on the trend in existing data on the number of farms that apply organic farming practices. For the years 2001-2003, the data for 2000 was used, with no assumed trend over these years. After 2003, data from the Ministry of Agriculture’s ‘Green Report’.

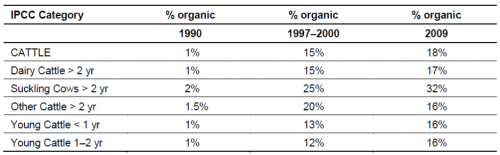
The resulting estimate of livestock population in organic and conventional farming systems in different periods is shown in the table below. Because organic and non-organic cattle diets vary, the resulting activity data was then applied to different estimates of gross energy (GE) intake for each sub-type of cattle in each production system.

Table 1. Estimated proportion of the population of cattle sub-types in organic production systems in Austria

Source: Austria NIR 2011


Author: Andreas Wilkes, Values for development Ltd (2019)

Livestock inventory practice: Estimating digestibility using a country-specific approach in the UK

Keywords: filling data gaps | feed digestibility | national energy balance model | dairy cattle

Country context: In the early 2000s, cattle contributed about one-third of UK total emissions of methane. In the early inventories, emission factors were separately estimated for four types of cattle (dairy breeding cows, beef cows, other cattle >1 year and other cattle <1 year. This was later increased to 8 sub-categories of cattle. Dairy cattle are a major source of emissions.

What data needs were addressed? Improved estimates of feed digestibility were needed.

Why was the data needed? The UK’s national GHG inventory implements the IPCC Tier 2 model for enteric fermentation and manure management, in which feed digestibility is an important input. When the Tier 2 model was first used, the UK used expert judgment and IPCC default values. Subsequently, improvements in knowledge in the dairy sector indicated that these prior estimates required revision.

Methods used: A national energy balance model developed for farm feed and nutrition planning was used.

How was the data gap addressed? For dairy cows, a country-specific approach to estimating digestibility of feed (DE%) has been developed. This country-specific approach is based on the models that underlie extension advice to farmers using the Feed into Milk (FiM) model. The reason for using this country-specific approach is that feed concentrate provides an important part of the dairy cow diet. The Feed into Milk model was developed to provide a better estimate of voluntary feed intake in order to better meet the energy and protein requirements of high-yielding dairy cows.

The FiM model was developed in the early 2000’s to replace earlier (1993) feed nutrition tables as the basis for software programs for use by farmers in feed and nutrition planning. The model has modules for the prediction of feed intake, energy requirements and supply, and protein requirements and supply.

Feed intake equations were specifically developed using data from cows fed on different diets in experiments at several UK research institutes and were validated against independent datasets. Thus, the equations can be used to predict feed intake across a range of forage and concentrate diets. The feed intake prediction equation uses information on concentrate intake and its protein content, body condition, live weight, milk energy output, week of lactation and starch content of forage. In particular, the feed intake equation developed predicts intake of grass silage-based diets more accurately than previous equations used to inform dairy nutrition advice.

Extension advice for dairy production in the UK has been based on the UK metabolizable energy (ME) feeding system, first proposed for use in the UK by the agricultural Research Council in 1965 (with revisions in 1980, 1990 and 1993). One strength of the system is that its mathematical structure enables it to easily be used in conjunction with feed value tables. The revision in FiM was needed to account for the higher genetic merit of modern cows, changes in representative diets and observed changes in ME requirements for maintenance. A new empirical model was made relating milk energy output (i.e. product of milk yield and gross energy concentration of the milk) and measured ME input, with full measurement of losses in feces, urine, methane and heat. The resulting equations predict ME requirements for maintenance and also the efficiency of ME use for lactation that varies with milk energy for lactation. On this basis, the total ME requirements for body weight gain, pregnancy, maintenance and milk production and activity can be estimated.

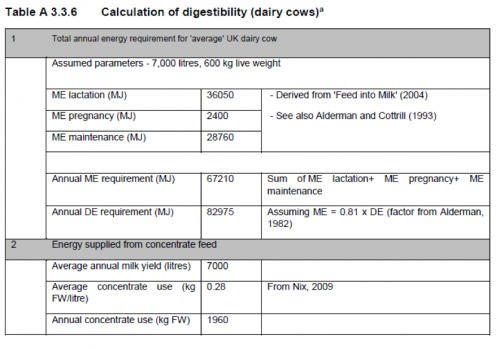
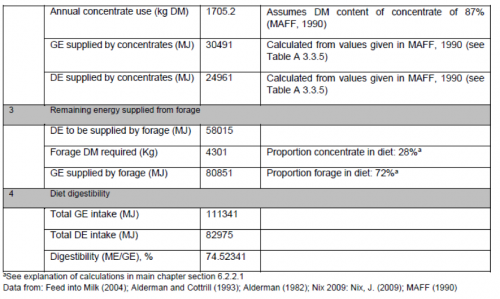
In the national GHG inventory, the FiM model is used to first estimate metabolizable energy for a typical level of milk production, in this case, 7000 liters. At this level of production, the farm management guide suggests average concentrate use of 0.28 kg per liter (Nix, 2009). The digestibility (DE as % of GE) value for concentrate feed (c. 82%) is estimated on the basis of a typical mix of protein and energy feed ingredients in concentrate. Using this value for ME supplied by concentrate, the annual ME requirement that has to be met from forage can then be derived. This is useful because the UK does not have detailed survey data on the amount of forage consumed by dairy cows. Assuming on the basis of expert opinion taking into account the proportion of time spent grazing by dairy cows that forage consists of 40% fresh grass, 50% grass silage and 10% maize silage, the relative proportions of concentrate to forage DM intake per year are estimated as 29% concentrate and 71% forage. The digestibility values for forage components are taken from the official feed nutrient value tables (MAFF, 1990).

The use of FiM is specifically for dairy cows. For beef cattle, digestibility values are based on expert opinion.


Further Resources

Thomas C. 2004. Feed into Milk: A new applied feeding system for dairy cows: An advisory manual.


Author: Andreas Wilkes, Values for development Ltd (2019)

Inventory practice: Livestock characterization and herd structure modeling in Georgia

Keywords: livestock characterization | expert judgement | herd modeling

Country context: Georgia is a country in the Transcaucasus region that lies between Eastern Europe and Western Asia. The common native cattle breeds Georgian Mountain and Red Mingrelian cattle are late maturing breeds, characterized by small body size and low milk yields with high fat content. Intensive production systems are limited, and most cattle are raised in extensive grazing systems. During the period of the Soviet Union, more productive early maturing breeds were introduced. Georgia’s GHG inventory began to use a Tier 2 approach for cattle in 2009. Prior to that, a Tier 1 approach was used by applying the IPCC default for the Asia region to late maturing breeds and the default values for Easter Europe to the early maturing breeds.

What data needs were addressed? Adopting a Tier 2 approach requires more detailed characterization of the cattle population, including sub-categories of cattle. However, national statistical data does not report any sub-categories of cattle.

Why was the data needed? Cattle account for about 90% of enteric fermentation emissions in Georgia. Enteric fermentation is a key source in the national GHG inventory. Therefore, following IPCC Guidance, a Tier 2 approach to estimation should be adopted, including enhanced characterization of cattle.

Methods used: Expert judgement for distribution of population among breeds; herd modelling for structure of the herd among age-sex groups.

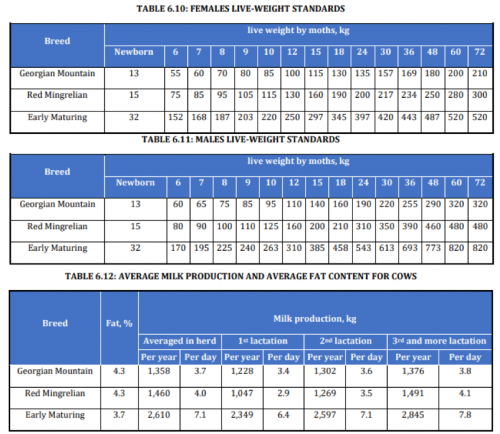
How were livestock characterized? Georgia’s GHG inventory categorizes cattle by breed as Georgian Mountain breed, Red Mingrelian or early maturing breed. This is because the characteristics of each breed differ (e.g. in terms of animal weight, milk production, fertility etc). Within each breed (or breed type), cattle are categorized into 17 types: 3 age groups of cow, 3 age groups of lactating cow, 3 age groups of bull (castrate), 3 age groups of bullocks, 3 age groups of heifers, and male and female calves <1 year old. Emission factors are estimated separately for each age-sex category for each breed.

The proportion of each breed in the whole cattle population was estimated using expert judgement. Then, within each breed, the annual population of each sub-category was estimated using a simple herd model based on the following assumptions:

  1. Early maturing cattle have first calving at 3 years old, and are mature at 5 years old.
  2. Late maturing cattle have first laving at 4 years old and are mature at 6 years old.
  3. The average lifetime of an animal is 15 years.
  4. A cow’s gestation period is 9 months, with lactation for 12 months and a 2 month dry period.
  5. The sex ratio of calf births is 50:50.
  6. With a preference for veal, the calf slaughter ratio is higher and slaughter is assumed to take place in the middle of the year.

By applying these rules in a monthly time step model, the age and sex structure of the cattle population of each breed changes on a monthly basis and annual population estimates can be derived, considering the number of months each animal type is alive. Emission factors for each sub-category of animal are then estimated on the basis of age, sex and breed-specific characteristics (see examples in Tables 1-3), which are then applied to the modeled population to estimate total emissions.

Source: Georgia NIR 2016


Photo by Daniil Nenashev/World Bank

Author: Andreas Wilkes, Values for development Ltd (2019)

Inventory practice: Integrated data management in Denmark

Keywords: inventory database

What data needs were addressed? Structured data management for accurate and consistent estimates of emissions.

Why was the data needed? To determine GHG emissions from enteric fermentation and manure management and ensure that data is managed for consistency, completeness and timely submission of the inventory.

Methods used: Design of an integrated relational database system.

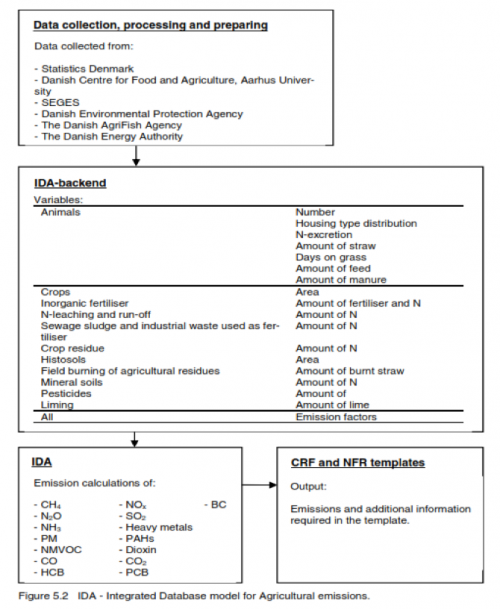
How was the data need addressed? To enable structured input data management as well as establish linkages between some of the input data collected, the ‘Integrated Database model for Agricultural Emissions’ was developed by the Department of Environmental Science of Aarhus University. In one database, ‘IDA-backend’, input data is stored and updated annually. The database is linked to a number of equations in the actual IDA database, where the calculations of emissions are implemented. Only the input data is updated annually, the equations and calculations are then automatically updated in the system.
Differentiated according to livestock type, weight class and age, 39 different livestock categories are represented within IDA. Using housing and manure types, these categories are further subdivided, resulting in 269 different combinations of livestock sub-categories and housing types. For each of these combinations, information on feed intake, digestibility, excretion and grazing days is included, and emissions are calculated.

The system enables the consistent estimate of GHG emissions from livestock. It is used to cover emissions of air pollutants and greenhouse gases. A direct link between input data is used to estimate methane emissions from enteric fermentation and manure management. Furthermore, a direct coherence exists between input data used to estimate methane, ammonia (NH3) and N2O emissions.


Further Resources

Danish emission inventories for agriculture: inventories 1985-2015.


Author: Andreas Wilkes, Values for development Ltd (2019)

Inventory practice: The role of cow recording systems in Norway’s Tier 2 approach

Keywords: livestock information resources | cow registers | dairy cattle

Country context: Until 2006, Norway used a Tier 1 approach for estimating enteric fermentation in cattle. Enteric fermentation was identified as a key source due to uncertainty in both the level and trend in emissions. NIR 2006 first adopted a Tier 2 approach. Norway’s Tier 2 approach is a country-specific method in line with IPCC guidance. It was designed to take advantage of information resources available in the livestock sector.

Livestock information resources used: Subsidy payment database; cow recording system; research.

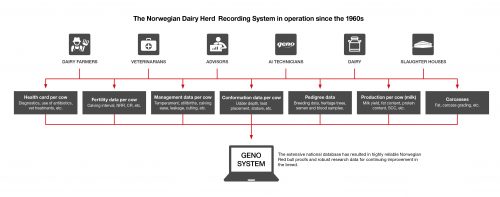
How did livestock sector information resources help shape the Tier 2 approach? Since the 1960s, the Norwegian Dairy Herd Recording System (NDHRS) has been operated by TINE SA, a farmer-owned dairy cooperative. The NDHRS covers almost all dairy cows in the country. The system collects a range of information on dairy cows that is used for various purposes, including animal health monitoring and genetic evaluation. Some of the information is also used in the national GHG inventory.
Source: Historical breeding program

Data on the population of 8 sub-categories of cattle in the GHG inventory derive from the official registry of production subsidies, which covers more than 90% of animals. Data on parameters used to estimate emissions per head per year for each sub-category derive from the NDHRS. The NDHRS includes records of physiological status (dry, lactating or pregnant), annual milk production, feeding, live weight, slaughter age, slaughter weight and average daily weight gain (ADG) for growing cattle, which are utilized in the calculations for growing cattle.

For dairy cattle, Norway’s Tier 2 approach takes account of both milk production levels and diet composition. In particular, Norway’s approach uses equations to estimate gross energy (GE) and methane conversion rate (Ym) on the basis of milk yield and feed characteristics, both of which are recorded in the NDHRS. Although the specific equations used to estimate GE and Ym have developed over time, the basic input data continue to be supplied by the NDHRS. The data available in the recording system have thus played a key role in shaping Norway’s choice of estimation method.

When Norway first developed its Tier 2 approach, more than a million observations from the NDHRS were used to develop standard lactation curves in 500 kg intervals from 4500 to 9500 kg (over a 305 day period). Standard feed rations for each 500 kg interval were then calculated using different combinations of forage quality and different levels of concentrate to produce low, medium and high energy content rations at each production level. These standard rations thus covered the normal range of forage qualities as indicated by the feed information in the NDHRS. Initially, feed energy values were estimated using the Dutch net energy lactation system that had been the official energy system in Norway since the early 1990s. Later, this was replaced by energy values estimated using the Nordic feed evaluation system (NorFor), but the overall approach remained the same.

For estimation of methane emissions, Norway’s initial Tier 2 approach used two equations based on overseas research that had been published in the literature: an equation by Mills et al. (2003) was used to predict daily CH4 production on the basis of feed intake and dietary ADF and starch content; and an equation described by Kirchgessner et al. (1995) was used to predict CH4 per day on the basis of crude protein and fat and NFE contents of the diets. The estimated CH4 emissions were taken as the average of the values predicted by these two equations.

The 305 day lactation curves and the standard feed rations modeled were then used to estimate average daily GE intake across each stage of lactation, at different milk yield levels and with different concentrate proportion in the diet. The reason this was done is because milk yield and concentrate proportion are available in the NDHRS. The resulting equation (GE = 150.8 + 0.0205 • Milk305 + 0.3651· Concentrate_prop) enables GE to be estimated on the basis of milk yield and concentrate proportion in the diet, both of which are available from the NDHRS. Another equation was also developed for Ym (Ym = 10.0 – 0.0002807 · Milk305 – 0.02304 · Concentrate_prop) that uses these input data.

These prediction methods were subsequently updated, but the methodological approach remains the same. On the basis of published research using the NorFor model (Storlein et al. 2014), a new equation predicting daily methane emissions on the basis of DMI and fatty acid content was used (CH4 (MJ/d) = 6.80 + 1.09 × DMI − 0.15 × FA), along with revised equations for GE (GE = 137.9 + 0.0249 × Milk305 + 0.2806 • Concentrate_proportion) and Ym (Ym = 7.15 – 0.00004 × Milk305 – 0.00988 × Concentrate_proportion). The estimated Ym values using the revised method were closer to those suggested in the IPCC 2006 Guidelines than the estimated values using the previous equations.

Thus, as Norway gradually improved the specific methods used to estimate dairy cattle emissions, the overall methodological approach remained the same. The availability of data from the NDHRS to populate the country-specific models was one key factor determining the choice of country-specific approach.


Further Resources

Norway Statistics Office, 2011. National Inventory Report, Appendix H: Enteric methane emissions from cattle and sheep population in Norway. Method description.

Storlein TM, Harstad OM. 2017. Enteric methane emissions from the cattle population in Norway. Annex IX in Norway NIR 2017.

Storlien TM, et al. 2014. Prediction of enteric methane production from dairy cows. Acta Agriculturae.

Scandinavica, Section A—Animal Science, 64(2): 98-109.


Author: Andreas Wilkes, Values for development Ltd (2019)