Livestock inventory practice: Choice of emission factor for manure management in Japan

Keywords: Decision tool | manure management

What data needs were addressed? Choice of emission factor for methane manure management emissions.

Why was the data needed? Japan has a considerable body of data from direct measurements of manure management methane emissions, and early inventories used these measurement results. In order to improve the reliability of the inventory, in NIR 2006 a decision tree was applied to guide the choice of data for emission factors.

Methods used: decision tree

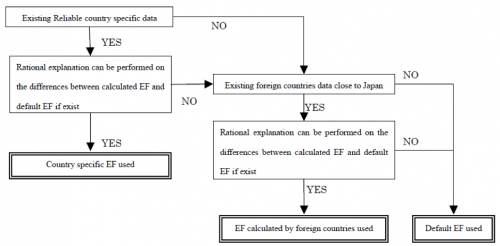
How was the data need addressed? The 2006 IPCC Guidelines note that while using direct measurements of emissions to parameterize models for estimation of emission factors may be a good approach, measurements are difficult to conduct, and require significant resources and expertise, and equipment that may not be available. Direct measurements are not required for good practice as defined by the IPCC. Hence, Tier 1 and Tier 2 approaches are proposed as alternatives. Japan has a considerable body of data from direct measurements. However, not all the measured results were similar to IPCC default values. Therefore, a decision-tree was developed to guide the selection of emission factors (EFs) for manure management emissions (Figure 1).

Figure 1: Decision-tree for guiding the selection of EFs for manure management emissions in Japan.

Source: NIR 2018

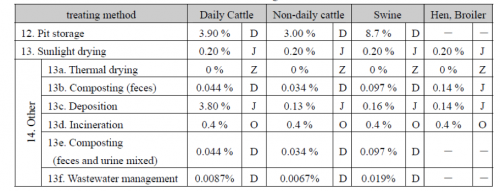
As a result of applying the decision tree, a mixture of IPCC default values, country-specific values and values based on research in other countries is used (Table 1). By continually applying the decision tree to research results newly available in each year, Japan has gradually replaced some EFs with country-specific values, but continues to use default values where better estimates are unavailable.

Table 1: Manure management methane emission factors for cattle, pigs and poultry in Japan’s national inventory

Note: D = IPCC default; J = Japan; O = other countries; Z = not applicable.

Source: NIR 2006


Author: Andreas Wilkes, Values for development Ltd (2019)

Inventory practice: Verification of livestock emission factors in South Africa

Keywords: QA/QC | verification

What data needs were addressed? Verification of country-specific emission factors.

Why was the data needed? When South Africa first developed country-specific emission factors, Australian models of enteric fermentation were adopted, because conditions in Australia and South Africa are similar. Emission factors for South African livestock were developed by Du Toit et al. (2013a, 2013b, 2013c, 2013d) using Australian models for estimating enteric fermentation from ruminants, pseudo-ruminants and. The emission factors were estimated for the year 2010. The resulting emission factors were significantly different from those recommended by the IPCC for the African continent. Therefore, a method to compare emission factors and justify the choice of emission factor was needed.

Methods used: comparison with other emission factors.

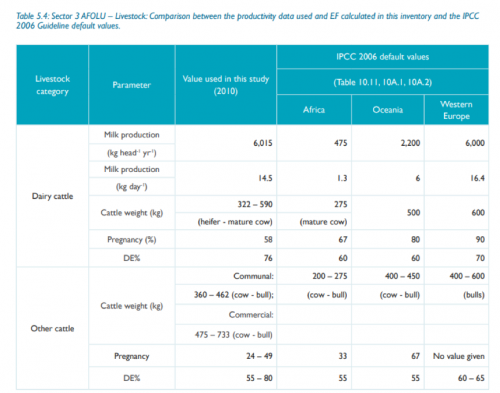
How was the data need addressed? South Africa’s National Inventory Report (2014) compared the estimated emission factors with IPCC default values for Africa, Oceania and Western Europe and explored the underlying productivity data used to derive the IPCC default emission factors.

Comparison of emission factors showed that South Africa’s country-specific EFs were in the same range as the defaults for Oceania and Western Europe, but were not similar to defaults for Africa. This is explained by the productivity data. Milk production in South Africa in 2010 was 14.5 kg per day, much higher than the assumed 1.3 kg per day given for Africa. Cattle weights were also much higher (333 590 kg, compared to 275 kg for Africa). Pregnancy and DE percentages were also higher than those used in the IPCC default values.


Resources

Du Toit CJL, Van Niekerk WA. 2013a. Direct methane and nitrous oxide emissions of South African dairy and beef cattle. South African Journal of Animal Science.

Du Toit CJL, Van Niekerk WA. 2013b. Direct methane and nitrous oxide emissions of monogastric livestock in South Africa. South African Journal of Animal Science.

Du Toit CJL, et al. 2013c. Direct greenhouse gas emissions of the game industry in South Africa. South African Journal of Animal Science.

Du Toit CJL, et al. 2013d. Direct greenhouse gas emissions of the South African small stock sectors. South African Journal of Animal Science.


Author: Andreas Wilkes, Values for development Ltd (2019)

Inventory practice: Improving estimates of cattle weights in New Zealand

Keywords: Expert review | animal weight | cattle | Oceania

Country context: Grassland-based animal husbandry makes major contributions to New Zealand’s economy. The country’s GHG inventory has used a Tier 2 approach for cattle, small ruminants and deer since the early 1990s. Since then, New Zealand’s Tier 2 livestock inventory has undergone three major stages of development (see Country Inventory Case Study: New Zealand). The inventory has maintained its current structure since 2009, and within that structure various improvements in emission estimates have been made (see Inventory practice: New Zealand’s Agriculture Inventory Advisory Panel).

What data needs were addressed? Improved estimates of live weights for ewes and beef cows.

Why was the data needed? New Zealand’s inventory is based methane emissions model that estimates emissions on the basis of estimated energy and feed intakes. Since most energy consumed by breeding animals is used for maintenance, animal live weight is closely related to energy and feed intake estimates. Feed intake is estimated on the basis of live weight, but estimation of live weight in the model is done using data on carcass weight and an assumed carcass ratio (i.e. dressing out percentage). A review of the national inventory model (Muir et al. 2008) suggested that the ewe and beef cow carcass or live weight estimates and carcass ratios used in the model were based on limited data and assumptions that might lead to significant errors in the inventory estimates.

Methods used: Expert review of available data, including slaughter weight data, and collection of primary data.

How was improved data derived? New Zealand has an advisory panel that meets annually to deliberate on and recommend improvements to the agricultural inventory (see Inventory practice: New Zealand Inventory Advisory Panel case study). Based on key information needs identified by the panel and the responsible ministry (the Ministry for Primary Industries), the ministry commissions reviews and other analysis to inform decisions about inventory improvements. In 2008, a review of the inventory model (Muir et al. 2008) suggested that the ewe and cow live weight estimates used in the model were based on limited data and assumptions that might lead to significant errors in the inventory estimates. The ministry commissioned a review of ewe and beef cow live weight estimates used in the model. The review assessed the appropriateness of the data and assumptions used in the inventory model by comparing the inventory live weight estimates with the best available published and unpublished data (including new data collected for the review) on both live weights and carcass ratios (i.e. killing out percentage). Because live weight data is typically collected either at mating time or at culling, the review also assessed the implications of the timing of data collection of providing an estimate of annual average live weight.

For beef cows live weight, the reviewers searched records in available journal publications, but most publications were found to be of limited use as they either reported results from feeding trials that are not representative of commercial production conditions, or reported on breeds that are not typical of the national herd. However, unpublished live weight data on 2100 cows was available from researchers. In addition, live weight of breeding cows was measured on 12 farms in 2009 and 2010 using breeds that are more representative of the national herd. Live weights were measured at weaning and pregnancy testing because this is when farmers identify animals for culling. By collecting data at this time, it was also possible to examine any differences in live weights between the culled animals and those that remained in the herd. For the culled animals, data on carcass weights was also collected to provide an estimate of the carcass ratio. The estimated carcass ratio was 42.6%, slightly lower than the 45% assumed in the inventory model.

Different sources of live weight estimates were compared. The most representative datasets were deemed to be the unpublished data from Landcorp (the state owned livestock enterprise), a research project previously funded by the ministry, and from the surveys conducted as part of the review. The first two data sources reported carcass weights, to which the carcass ratio estimated by the review survey was applied. The latter data source reported measured live weights. All these data sources reported heavier live weights that that used in the inventory model. The average across these data sources was taken as the basis for recommending that the inventory should use a figure of 547 kg for 2009/10.

Table 1: Live weight and carcass weight estimates for beef cows

DatasetHerd com LW (kg)Cull cow LW (kg)Carcass weight (kg)Carcass ration (%)
Landorp (2007/8)568*242
Ministry study (2007/8)537*229
Review survey (2008/9)51052722141.4
Review survey (2009/10)57355525243.9
Inventory model (2009/10)45145
Suggested revision54723642.6

* Estimated from measured carcass weight

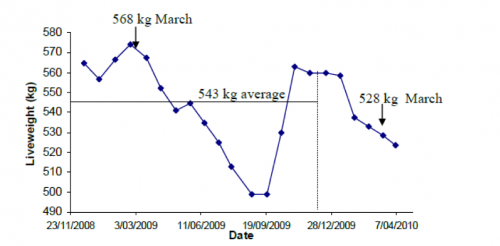
Cow live weight at pregnancy testing or weaning (i.e. end of summer) is often the annual maximum live weight, and slaughter mostly takes place over the summer, when live weights tend to be greater. If the live weight at pregnancy testing or culling is used, this would tend to overestimate annual average live weight. Unpublished data from one researcher and one farm was available to describe the seasonal change in live weight and estimate the extent to which slaughter data would overestimate annual average live weight (Figure 1). This analysis suggested that using slaughter data would tend to overestimate annual average live weight by 5-10 kg.

Figure 1: Liveweights in mixed aged beef cows (n-492) in Northland farm
Source: Muir and Thomson (2011)

In addition to estimating live weight in 2009-10, live weight estimates for the inventory would have to be applied to the inventory time series going back to 1990. Data was available on carcass weight for almost 100,000 beef cows slaughtered by Landcorp between 1997/98 and 2008/09. Applying the carcass ratio estimated by the review, a live weight time series was constructed that suggested an annual average increase in live weight of 8.5 kg/year. Extrapolating this back to 1990 suggests that in 1990/1991 the average beef cow would have weighed 402.5 kg, which is slightly higher than the 378 kg assumed for that year in the inventory model.

A similar analysis was conducted for ewes, using published, unpublished and newly collected live weight data, assessing the representativeness of the breeds weighed and the implications of the timing of weight measurements for deriving annual average live weight estimates.

The revised estimates were then applied to New Zealand’s inventory from 2012 onwards.


Further Resources

Pickering A. 2010. MAF Policy Agricultural Inventory Panel Meeting 17 August 2010.

Muir PD, Thomson BC. 2011. Better estimation of national ewe and beef cow liveweights. Report prepared for the Ministry of Agriculture and Forestry.

IPCC Guidance (IPCC 2006 Vol 4 Ch 10 p.10.12).


Author: Andreas Wilkes, Values for development Ltd (2019)

Inventory practice: Estimating milk yields in Luxembourg

Keywords: Milk yield

What data needs were addressed? Estimating milk yield per cow per year.

Why was the data needed? Luxembourg does not have detailed records on milk yields per cow per year, so needed to estimate milk yields from available data.

Methods used: calculation.

How was the data gap addressed? The national inventory uses the official estimate of milk production. This is calculated from the official amount of milk output by producers. It is calculated by Luxembourg Rural Economy Service (SER) by adding up:

  1. the amount of milk collected by the dairy industry directly from the farmers;
  2. the amount of milk and milk products directly sold by the farmers; and
  3. milk consumption on farm, including consumption by farming families and by animals.

Luxembourg has a population of 6000-7000 dairy cows and about 3000 suckler cows. The estimate of milk yield per head first assumes that suckler cows give 3500 kg per year on average. Since management practices have not changed over time, this value remains unchanged. The milk output due to suckler cows is calculated by multiplying the suckler cow population by 3500 kg. The remaining output is then divided by the number of dairy cows to produce an average annual milk yield per dairy cow.

Total milk output in Luxembourg has increased by about 23% between 1990 and 2015, while the dairy population has fallen by 20%. Hence, the implied emission factor for dairy cows has increased by 19% over this period.


Author: Andreas Wilkes, Values for development Ltd (2019)

Inventory practice: New Zealand’s agriculture inventory advisory panel

Keywords: Expert review | commissioned reviews | continuous improvement | institutional arrangements

Country context: Grassland-based animal husbandry makes major contributions to New Zealand’s economy. The country’s GHG inventory has used a Tier 2 approach for cattle, small ruminants and deer since the early 1990s. Since then, New Zealand’s Tier 2 livestock inventory has undergone three major stages of development (see Country Inventory Case Study: New Zealand). The inventory has maintained its current structure since 2009, and within that structure, improvements in emission estimates continue to be made. The Agricultural Inventory Advisory Panel plays a key role in the continuous improvement process.

Institutional arrangements: The Climate Change Response Act 2002 names the Ministry for the Environment as the agency in New Zealand responsible for compilation of the national GHG inventory. The MoE calculates estimates of emissions for the solvent and other product use sector, waste sector, emissions and removals from the LULUCF sector, and coordinates inputs from other sectors. The Ministry for Primary Industries (MPI, formerly Ministry of Agriculture and Forestry) compiles the agriculture sector inventory. This is supported by research conducted by public research institutes and universities. In 2009, MPI established an advisory panel that meets annually to deliberate on and recommend improvements to the agricultural inventory. The panel assesses peer-reviewed reports and papers providing evidence for proposed changes to the inventory, and advises whether the proposed changes are scientifically robust and meet the reporting guidelines. The panel advises MPI of its recommendations, and MPI must approve the recommendations before the recommendations can be implemented in the national inventory calculations. Hence, the role of the panel is advisory.

The panel is made up of representatives from the Ministry of Agriculture and Forestry, the Ministry for the Environment, and science representatives from the Royal Society of New Zealand, the New Zealand Agricultural Greenhouse Gas Research Centre, and experts on methane emissions (from New Zealand Methanet) and nitrous oxide emissions (from New Zealand N2Onet), which are groups of national experts in the areas of agricultural inventory methane and inventory nitrous oxide emissions respectively.

Based on key information needs identified by the panel and MPI, the ministry commissions reviews and other analysis to inform decisions about inventory improvements. The reviews and analysis are presented to the panel in the form of reports or papers. Each report or paper includes specific recommendations for changes to the inventory and/or further needs for research and analysis, as well as the supporting evidence for these recommendations. The papers are peer-reviewed by the panel members, who submit review reports. The MPI then prepares a briefing paper, which summarizes the main findings of the report and the peer-reviews, and sets out the recommendations to be noted, discussed or decided during the annual meeting of the panel. The panel assesses if the proposed changes have been rigorously assessed and if there is sufficient scientific evidence to support the recommendations made. Recommendations are decided by voting. If a panel member was involved in conducting the commissioned study, they are recused from voting. The minutes of the meeting and the recommendations made are recorded and posted along with the panel briefings and other reports on the MPI website.

The reports commissioned by MPI mostly involve review of available data, including published scientific journal articles, as well as unpublished data from research and industry sources. In some cases, commissioned reports also involve the collection of new primary data, for example where suitable data is unavailable. Topics deliberated by the advisory panel in recent years have included:

  • Recommendations for calculating national dairy sector emissions on the basis of regional estimates;
  • Revisions to ewe and beef cow live weight estimates (see Inventory Practice: Improving estimates of cattle live weight in New Zealand);
  • Revised methodologies for calculating N2O emission factors;
  • Revised equations for methane emissions from anaerobic effluent ponds;
  • Revisions to parameters used in the inventory for emissions from deer populations;
  • Revised uncertainty estimates; and
  • Revisions to the livestock population model used in the inventory.

Further Resources

MPI Agricultural Inventory Advisory Panel


Author: Andreas Wilkes, Values for development Ltd (2019)

Inventory practice: Institutional arrangements for compilation of the UK‘s livestock emissions inventory

Keywords: Institutional arrangements

Institutional arrangements:
The UK’s greenhouse gas inventory is compiled and maintained by a consortium of institutions under contract to the Department for Business, Energy and Industrial Strategy (BEIS). The consortium is led by Ricardo Energy & Environment, which is responsible for producing the emissions estimates for energy, industrial processes and waste sectors, and for inventory planning, data collection, QA/QC and inventory management and archiving. Agricultural sector emissions (CRF sector 3) are produced by Rothamsted Research, under contract to the Department for Environment, Food & Rural Affairs (DEFRA).

As the contractor responsible for the agriculture inventory, Rothamsted Research is responsible for:

  • activity data, methods, emission factors and emission estimation;
  • preparing and developing the agriculture inventory and delivering on time for incorporation into national inventory;
  • delivering the finalized GHG emissions data to Ricardo Energy & Environment;
  • maintaining documentation and archiving of models and procedures used; and
  • participating in sectoral expert panels as required.

Ricardo Energy & Environment are responsible for checking consistency between outputs.

The UK has established a National Inventory Steering Committee (NISC) as a cross-government body. The NISC is tasked with the official consideration and approval of the national inventory prior to submission to the UNFCCC. This pre-submission review is done at a NISC meeting prior to the finalization of the inventory, and any recalculations to the inventory are presented and discussed at this meeting. The NISC also assists the BEIS GHG inventory management team to manage and prioritize the over-arching inventory QA, facilitate review and improvement, and improve communication between inventory stakeholders across government departments. Members of the Steering Committee include the Inventory Agency team at Ricardo Energy & Environment, other contractors, plus appropriate sector, legal and economic experts. These experts are responsible for reviewing methodologies, activity data, emission factors and emission estimates at a sectoral level and report their findings and recommendations to the steering committee on a regular basis. The committee is responsible for ensuring that the inventory meets international standards of quality, accuracy and completeness, and is delivered on time each year to the EU Monitoring Mechanism Regulation and the UNFCCC.

The NISC is responsible for agreeing the priorities for the UK GHGI improvement program. The NISC meets twice a year to discuss the outcomes of recent peer, internal and expert reviews and to agree the prioritization, funding, implementation and review of items on the UK inventory improvement program.

The Key Category Analysis and the uncertainty analysis, qualitative analysis from inventory experts and recommendations from reviews of the UK GHG inventory are used as guidance to help the members of the NISC make decisions on which improvements are the most important. Key categories with high uncertainty are given priority over non-key categories or categories with a low uncertainty. The annual inventory review feedback from the UNFCCC and outcomes from QA/QC checks and reviews carried out under the MMR and ESD, as well as sector-specific peer- or bilateral review findings are also considered to guide decisions on UK GHGI improvement priorities.


Author: Andreas Wilkes, Values for development Ltd (2019)
Inventory practice: Institutional arrangements for compilation of Finland‘s livestock emissions inventory

Keywords: Institutional arrangements

Institutional arrangements: Statistics Finland is responsible for Finland’s greenhouse gas inventory. Statistics Finland maintains agreements between the inventory unit and expert organizations that produce the emission estimates and maintain related documentation. The agreement between Statistics Finland and expert organizations define the division of responsibilities and tasks, including those related QA/QC. They also specify the procedures and schedules for the annual inventory process coordinated by Statistics Finland. All the expert organizations are represented in an inventory working group. The working group facilitates collaboration and communication between the inventory unit and the experts producing the estimates for the different reporting sectors, and ensures the implementation of the QA/QC and verification process of the inventory. The agriculture sector emissions inventory is compiled by Natural Resources Institute Finland (LUKE), including estimates for enteric fermentation and both methane and nitrous oxide from manure management. LUKE is the agency that publishes livestock population data and other farm management data, such as animal weight, average daily weight gain, milk production per dairy cow and suckler cow, pregnancy, duration on pasture and manure management data. The resource for the participation of LUKE are channeled through the Ministry of Agriculture and Forestry so that the data collected in the process of public administration duties can be used in the emission inventory.

During the inventory compilation, the calculation sheets and data related to inventory are stored in personal folders in the server maintained by the information services of the Natural Resources Institute Finland (Luke). The folder structure is similar for each inventory year, which makes data management easier. A limited group of persons have access rights to the files. After the compilation, the results and relevant data reported to Statistics Finland and are archived in LUKE’s write-protected electronic archive.


Author: Andreas Wilkes, Values for development Ltd (2019)
Inventory practice: Institutional arrangements for compilation of Canada‘s livestock emissions inventory

Keywords: Institutional arrangements

Country context: Canada’s inventory estimates for cattle emissions are based in part on prior research that established typical management practices and performance of cattle in different production systems in each province (see Inventory Practice: Structured elicitation of expert judgement in Canada’s initial Tier 2 inventory, and Inventory Practice: Structured elicitation of expert judgement on manure management practices in Canada). The main activity data required to compile the annual inventory are livestock population numbers and data on milk yields for dairy cattle and carcass weight for beef cattle.

Institutional arrangements:
Environment and Climate Change Canada is the federal agency responsible for preparing and submitting the national inventory to the UNFCCC. Canada’s inventory is developed, compiled and reported annually by Environment and Climate Change Canada’s Pollutant Inventories and Reporting Division. In order to facilitate inventory compilation using data from different sources, Environment and Climate Change Canada has developed numerous agreements with data providers and expert contributors. Agreements include partnerships with other government departments (e.g. Statistics Canada, Agriculture and Agri-Food Canada), and arrangements with industry associations, consultants and universities.

For compilation of the inventory of livestock emissions, Statistics Canada provides data on livestock populations. Milk yield data are reported by Agriculture and Agri-Food Canada, which also publishes beef cattle carcass weight data in the basis of data collected by the Canadian Beef Grading Agency. In addition, Agriculture and Agri-Food Canada provides scientific support to the agriculture sector inventory, and numerous researchers have participated in some extensive reviews, validation of the parameter values selected and validations of the Tier 2 models used by comparing measured and observed emissions using Canadian data.


Author: Andreas Wilkes, Values for development Ltd (2019)
Inventory practice: Modeling rumen processes in The Netherlands

Keywords: methane conversion factor | modeling | dairy cattle

What data needs were addressed? More accurate estimation of methane emissions from dairy cattle.

Why was the data needed? To account for high nutritional quality of dairy rations in The Netherlands.

Methods used: Prediction of the CH4 conversion factor from feed intake and dietary characteristics, using a dynamic model.

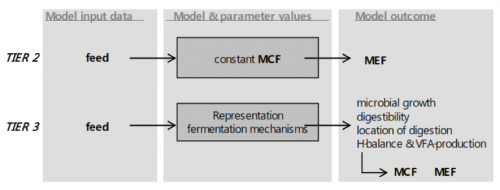
How was the data need addressed? Until 2005, The Netherlands used a Tier 2 approach to estimate methane emissions from mature dairy cattle. However, with high quality (and thus digestibility) of dairy rations, it was suspected the IPCC default value was too high. Furthermore, the constant default factor did not reflect variation in the level of feed intake, digestibility, composition and quality of the ration. Thus, the methodology was improved by adopting a country-specific Tier 3 approach.

Source: Bannink 2011

The approach is built on a model, originally developed for modeling rumen processes in dairy cattle. The model predicts methane production as a result of the microbial fermentation process in the gastrointestinal tract of dairy cattle. The model appeared suitable for modeling methane emissions as well by taking more detailed ration composition and quality into account.
Instead of using a constant country-specific emission factor, the model predics the methane conversion factor based on feed intake, ration composition, nutrient content and quality. The model represents the mechanisms for microbial degradation of feed particles. Using volatile fatty acids as end-product of rumen fermentation, methane emissions can be estimated.
The emission factor, gross energy and methane conversion factor are calculated annually.


Further Resources

The Netherlands’ NIR 2018.

Bannink A, van Schijndel MW, Dijkstra J. 2011. A Model of Enteric Fermentation in Dairy Cows to Estimate Methane Emission for the Dutch National Inventory Report Using the IPCC Tier 3 Approach. Animal Feed Science and Technology, 166-167, 603-618.

Vonk J, van der Sluis SM, Bannink A, van Bruggen C, et al. 2018. Methodology for estimating emissions from agriculture in the Netherlands update 2018. Calculations of CH4, NH3, N2O, NOx, PM10, PM2.5 and CO2 with the National Emission Model for Agriculture (NEMA).

Wageningen, The Statutory Research Tasks Unit for Nature and the Environment (WOT Natuur & Milieu). WOT-technical report.


Author: Andreas Wilkes, Values for development Ltd (2019)
Inventory practice: Institutional arrangements for compilation of Norway‘s livestock emissions inventory

Keywords: Institutional arrangements | Planning

Country context: Norway’s methodology for Tier 2 estimation of cattle emissions is structured around the availability of activity data in the TINE BA Cow Recording System (see Inventory Practice: The role of cow recording systems in Norway’s Tier 2 approach). This system collects data on individual milk production and feeding for dairy cows, and age at slaughter, carcass weight, and average daily gain for beef cattle. This well-defined source for most activity data required simplifies Norway’s centralized compilation of the GHG inventory for cattle.

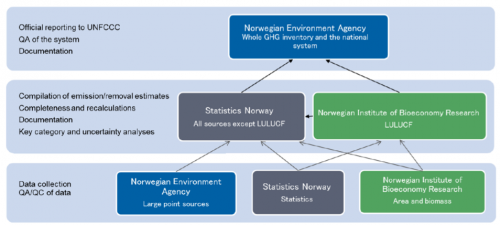
Institutional arrangements: Compilation of Norway’s inventory is the responsibility of three institutions: The Norwegian Environment Agency, Statistics Norway and the Norwegian Institute of Bioeconomy (NIBIO). Statistics Norway is responsible for the calculation of emissions from the agriculture and several other sectors. To ensure that the institutions comply with their responsibilities, Statistics Norway and NIBIO have signed agreements with Norwegian Environment Agency as the national entity. Through these agreements, the institutions are committed to implementing the QA/QC and archiving procedures, providing documentation, making information available for review, and delivering data and information in a timely manner to meet the deadline for reporting to the UNFCCC.

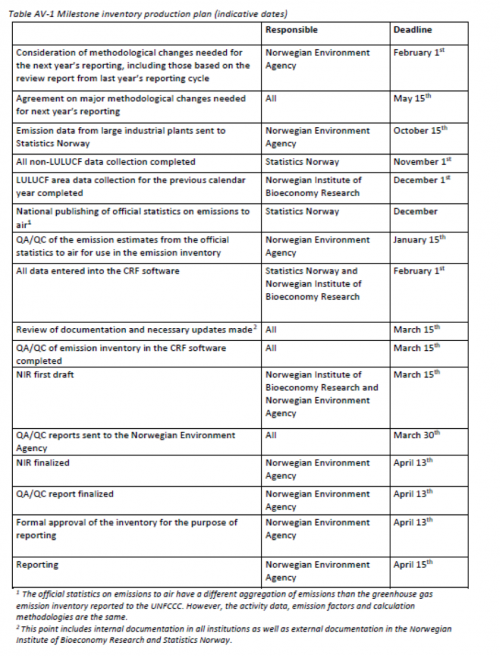
Inventory compilation process: The three institutions involved agree a “milestone” production plan (Table 1), and each institution prepares their corresponding plan. Sector experts at Statistics Norway obtain data on animal populations and performance parameters recorded in the TINE BA Cow Recording System. Once data has been collected and QA/QC activities conducted, data is documented and archived separately by each of the three institutions. The archived information includes all input data, all estimated emissions, common reporting format tables, all technical documentation and details of any recalculations. The archiving systems used by each institution are consistent, which enables consistent QA/QC procedures to be applied.

Table 1. Production plan


Author: Andreas Wilkes, Values for development Ltd (2019)