Livestock inventory practice: Estimating cattle weights in the UK

Keywords: filling data gaps | animal weight | surrogate data | cattle | Europe

Country context: In the early 2000s, cattle contributed about one-third of UK total emissions of methane. In the early inventories, emission factors were separately estimated for four types of cattle (dairy breeding cows, beef cows, other cattle >1 year and other cattle <1 year. This was later increased to 8 sub-categories of cattle.

What data needs were addressed? Estimating average weights of cattle sub-categories.

Why was the data needed? The UK’s national GHG inventory implements the IPCC Tier 2 model for enteric fermentation and manure management, in which animal weight data is an important input. However, when the Tier 2 model was first used, the UK had no official data on cattle weights. In its initial Tier 2 inventories, animal weight in 1990 was estimated by expert judgement, and animal weight for subsequent years was estimated by assuming a 1% increase per year. In the mid-1990s, this method was replaced with data from expert judgement from staff of the responsibility government department, and by estimating average weight using the rolling average of previous estimates. In NIR 2007, for dairy cattle, these methods were replaced with the use of slaughter weight data, while constant weight estimated using expert judgement was assumed for beef cattle. Subsequently, in-depth analysis of slaughter weight data was used to provide better estimates of animal weight for both dairy and non-dairy cattle.

Methods used: estimation using slaughter weight data.

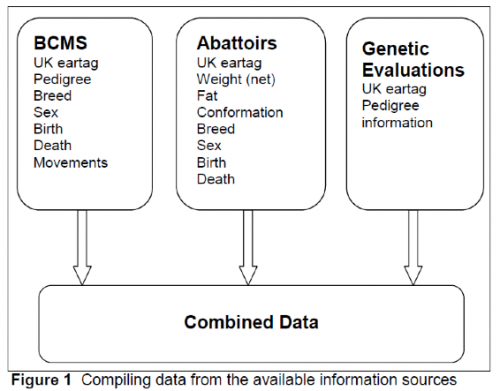
How was the data gap addressed? The UK’s livestock sector has suffered from several major disease outbreaks in the past 3 decades. One side-effect has been that more comprehensive registration and tracing of cattle. For example, the British Cattle Movement Service (BCMS) was set up in the wake of the BSE crisis in the late 1980s. The relevant legislation requires all bovines to have a unique ear tag and a cattle ‘passport’, which are handed to the abattoir at slaughter, enabling full traceability of the source of all bovines slaughtered. EU legislation also required that a computerized system was put in place, and since the late 1990s, a Cattle Tracing System (CTS) records all births, movements and deaths. The CTS operates in England, Scotland and Wales, while a separate system operates in Northern Ireland. Abbatoirs are also legally obliged to identify each animal’s provenance (through the ear tags and passport) and also collect data on carcass weight and record the category of animal (e.g. cow, heifer, steer, young or mature bull or calf).

Source: Pritchard and Wall Selection opportunities from using abattoir carcass data

Both CTS and abattoir data record ear tag numbers, but the two datasets had never before been matched. Research by Tracey Pritchard and Eileen Wall at SRUC, primarily conducted for the purpose of producing estimated breeding values from carcass traits, matched the BCMS dataset with abattoir data. For the purpose of estimating weights for the GHG inventory, ear tag numbers and associated birth date and sex records from the BCMS dataset were matched with ear tag numbers, sex record and net weight data from 6 abattoirs. In 2014, 3.9 million carcass records from 2001-2014 were obtained from the abattoirs, representing about 30% of the national slaughter population. For 4 abattoirs, almost all ear tag identifiers could be matched with identifiers in the BCMS dataset. For two abattoirs, however, because a portion of intake came from Ireland or Northern Ireland, the datasets could not be matched. The data also had to be cleaned to remove very low net carcass weight estimates that probably represented erroneous data entry. Thus, the average net carcass weight for each category of cattle (defined by age at slaughter and sex) could be calculated. A comparison of the national herd population data with the structure of the abattoir sample data showed that the composition of the abattoir sample closely resembled that of the national herd. Thus, although the data represent 30% or less of the national herd slaughtered every year, it can be considered representative.

The net carcass weight data supplied by the researchers to DEFRA for GHG inventory compilation is then converted to a live weight estimate assuming a killing out percentage of 50%, which was applied to all breeds. This estimate derived from research conducted in Ireland which has similar breeds and production systems to much of the UK that was published in a scientific journal (Minchin et al. 2009).

The original research that produced these data continues with funding from the Agriculture and Horticulture Development Board a statutory levy board independent of industry and government to further research on the genetics of lifetime performance. Several abattoirs now send slaughter records on a monthly basis by automated data transfer. The BCMS and the abattoirs have signed data-sharing agreements with SRUC, as the data is commercially sensitive. The use of the data for making inputs into the national GHG inventory is the only agreed use outside of the primary purpose of the genetics research.


Further Resources

Moore K, et al. (n.d.). Using abattoir generated data and BCMS records for carcass trait evaluations. Final project report.

Wall E, Coffey M, Pritchard T. (n.d.). Selection opportunities from using abbatoir carcass data. In Proc. Assoc. Advmt. Anim. Breed. Genet (Vol. 20, pp. 253-256).

Minchin W, Buckley F, Kenny DA, Keane MG, Shalloo L, O’Donovan M. 2009. Prediction of cull cow carcass characteristics from live weight and body condition score measured pre-slaughter. Irish Journal of Agricultural and Food Research.


Author: Andreas Wilkes, Values for development Ltd (2019)

Livestock inventory practice: Estimating a time series for milk yields in Canada

Keywords: filling data gaps | milk yield | extrapolation | dairy cattle

Country context: Canada is a large and diverse country. Production practices vary across the country
with differences in land prices, climate, forage availability and market access. Canada’s inventory adopts a Tier 2 approach, but the inventory uses static values for the basic parameters describing dairy cattle production. For example, live weight, pregnancy rates and so on have the same value in each year. However, milk yield changes markedly over time.

What data needs were addressed? To develop a national time series for average milk yield per animal.

Why was the data needed? Milk productivity has increased in all Canadian provinces over time. CanWest DHI a producer-owned milk recording organization collects a sample of milk production representing more than two-thirds of the Canadian dairy cow population for the period of 1999–2015. These data give the best estimate of actual milk production per cow per province in Canada. However, from 1990 to 1998, this data set does not exist for the whole country. The only data that are available from 1990 to 1998 for all of Canada are data reported by Agriculture and Agri-Food Canada, which are collected on the most productive animals and during the first 305 days of lactation only.

Methods used: extrapolation.

How was the data gap addressed? The time series of real milk production for the entire Canadian herd from 1990 to 1998 was calculated based on the average ratio between the data published by Agriculture and Agri-Food Canada and the milk recording data from 1999 to 2007. The trend of increased milk production is then reflected in the emission factor for dairy cows.


Author: Andreas Wilkes, Values for development Ltd (2019)

Inventory practice: Estimating milk yields in Slovenia

Keywords: filling data gaps | milk yield | extrapolation | dairy cattle

Country context: In the early 2000s, when Slovenia adopted a Tier 2 approach, cattle were responsible for about 90% of enteric fermentation emissions. The proportion due to dairy cattle has been declining over time, and in NIR 2017 less than 50% were from dairy cattle. However, average milk yield has been increasing from 2775 kg/head/year in 1990 to about 5590 kg/head/year in 2015.

What data needs were addressed? Distribution of milk yield in the dairy cow population

Why was the data needed? Slovenia’s national GHG inventory applies the IPCC model in a country-specific approach. In the initial Tier 2 submissions (e.g. NIR 2003), the IPCC model was used to estimate enteric fermentation methane emissions for 18 sub-categories of dairy cow defined by the level of milk yield (e.g. 1000 1500 L/ head/year; 1500 2000 L/ head/year…>9000 L/ head/year). A statistical relationship was then established between CH4 emissions/head/year and milk yield kg/head/year. One option would be to apply the relationship to the average yield, but a better estimate would be obtained if the distribution of milk yields in the dairy cow population is known. Once the distribution of dairy cow milk yield in the population is known, then the inventory compiler can then estimate CH4 emissions using this activity data. However, there was no official data that reports the distribution of milk yields for all Slovenian dairy cows. Milk yield monitoring data was available, however, from a sub-set of the dairy cow population.

Methods used: extrapolation.

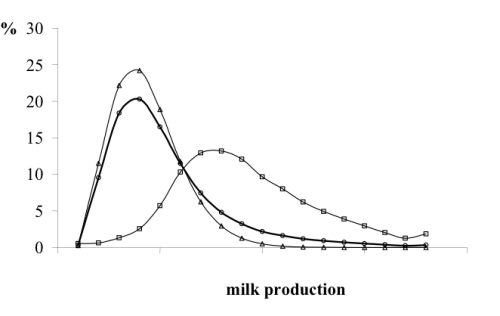
How was the data gap addressed? In 1999, the Cattle Breeding Service of Slovenia was monitoring monthly milk production by approximately 30% of the total dairy herd. These are referred to as ‘controlled cows’. Inspection of this data revealed that the annual milk yield data has a gamma function distribution. The average milk yield of the controlled cows, total cow population and total milk production from statistical data (with adjustment for suckling by calves) was used to estimate the distribution of milk yield in the non-controlled cow population, assuming that it shared the same distribution as the data from the controlled cows. An iterative method was used to fit the gamma function to the non-controlled population such that the average milk yield estimated was equal to the average milk yield implied by the national statistical data. The controlled and (modeled) non-controlled populations were then combined (Figure 1). The resulting data on the numbers of cows producing at different levels of milk yield, was then applied to the estimated emission factor appropriate to each level of production to estimate total dairy cow enteric fermentation emissions.

Figure 1: Theoretical distribution of the controlled herd (□), adjusted non-controlled herd (∆) and the entire, mathematically combined herd (○) of dairy cows

Source: Slovenia NIR (2004)


Author: Andreas Wilkes, Values for development Ltd (2019)

Inventory practice: Use of existing data on cattle diets in Denmark

Keywords: animal recording systems | feed tables | diet characterization | dairy cattle

What data needs were addressed? Definition of typical rations in the Danish dairy sector, which is used as input to calculation of gross energy per kilogram DM.

Why was the data needed? To estimate gross energy intake and establish the emission factor for dairy cattle, data on actual feeding practices (including nutrient content) is needed.

Methods used: data from dairy farm monitoring systems is used to create feed standards.

How was the data need addressed? In Denmark’s inventory, the calculation of gross energy per kilogram dry matter (DM) relies on the Danish Normative System. Normative standards are developed annually by the Danish Centre for Food and Agriculture (DCA), on the basis of data received from the central office for all Danish agricultural advisory services, SEGES.

The system is based on data on actual farming practices. In the dairy sector, 10% of the Danish dairy farmers are part of an intensive monitoring system, with the main purpose of establishing production benchmarks, optimizing productivity and research. Four to eight times a year detailed data on livestock numbers, animal weight and rations are collected. Additional feed bought from outside the farm is included in the data collection. The data is used to establish normative standards. The normative standards establish the GE per kg DM in feed.


Further Resources

Danish Centre for Food and Agriculture


Author: Andreas Wilkes, Values for development Ltd (2019)

Livestock country inventory: United Kingdom

Overview of UK’s current Tier 2 approach

The UK reports emissions from three cattle categories. It uses a Tier 2 approach for dairy cows and beef cows, and a Tier 1 approach for all other cattle (Table 1). A Tier 1 approach is used for all other livestock. For lambs, the UK has adjusted the Tier 1 IPCC default factor to UK conditions. Total emissions from enteric fermentation, enteric fermentation from cattle and enteric fermentation from sheep, and methane and nitrous oxide emission from manure management are identified as key categories in the latest inventory (NIR 2017). NIR 2018 used a thoroughly revised, country-specific Tier 2 approach for cattle.

Table 1: Overview of Tiers used for livestock methane emissions in the UK’s national GHG inventories

Livestock typesTier used for enteric fermentation (CH4)Year adopted*Tier used for manure management (CH4)Year adopted*
Dairy cowsT22003T22003
Beef cowsT22003T22003
Other cattleT1-T22003
SheepT2(T1)**2003**T22003
PigsT1-T1-
OtherT1-T1-

*Year refers to the year of NIR submission; ** Later discontinued, then re-adopted in NIR 2018.

Enteric fermentation

Until 2018, the UK used the IPCC model to estimate enteric fermentation emissions from dairy and beef cattle. In NIR 2018, the results of commissioned research were incorporated in the inventory, which now uses a country-specific method.

(1) Approach used until 2017

Until 2018, the UK implemented the IPCC Tier 2 model for dairy and beef cows. The approach estimates daily gross energy (GE) intake on the basis of animal performance, management practices and environmental factors. GE is converted to methane using a methane conversion factor (Ym), and estimated daily emissions are multiplied by number of days to make an estimate of annual emissions per head. Activity data on population of livestock of each category are multiplied by the EF to estimate total annual emissions from enteric fermentation for that category of livestock. An innovation in the UK’s implementation of the IPCC model is the use of a country-specific method for estimating feed digestibility, which it has used since NIR 2005 (see Inventory Practice UK’s country-specific method for estimating digestibility). This innovation used a country-specific energy balance model, the use of which was expanded in the country-specific methodology adopted in 2018.

Activity data: Livestock population data is provided each year from the Department of Environment, Food and Rural Affairs (DEFRA). This data is compiled from results of the agricultural census conducted in June every year by the devolved administrations (i.e. England, Wales, Scotland and Northern Ireland), which use the same livestock sub-categories to enable summation to UK population totals.

Emissions were separately estimated for breeding dairy cows, beef cows and six other types of cattle (Table 2). For dairy cows, until 2004 the dairy herd was defined as cows and heifers in milk plus cows in calf, but not in milk. In 2005, the dairy herd definition was changed to ‘cows over two years of age with offspring’, which does not include cows in calf, but not in milk (Agriculture in the United Kingdom data sets). Until NIR 2013, ‘other cattle’ included dairy heifers, beef heifers, others>2 and others 1-2 years old. This was later expanded to 6 categories (see Table 2) to better account for the different characteristics of dairy and beef animals (NIR 2013).

Table 2: Livestock categorization in the UK’s Tier 2 approach 2013-2017

Dairy cowsBeef cowsOther cattle
1 category (‘dairy breeding herd’ which is defined as dairy cows over two years of age with offspring)1 category6 categories: dairy heifers, beef heifers, dairy replacements > 1 year, beef all other > 1 year, dairy calves < 1 year, beef calves < 1 year

Animal performance data needed for IPCC model equations:

Dairy cows: For dairy cows, the UK used country-specific data for dairy cow live weight, milk yield, milk fat content, feed digestibility and activity (proportion of the year spent grazing), each of which varies from year to year. The estimated EF thus tracks change in management practice and animal performance on an annual basis. All other parameters used IPCC default values. See Table 3.

In early NIR submissions, the UK estimated dairy cow live weight by assuming a 1% annual increase compared to the figure for 1990. In NIR 2008, the data source and method used to estimate live weight changed to use data from a carcass weight survey adjusted for a carcass ratio of 0.48. Since the BSE crisis in the 1990s, slaughter must take place at designated facilities, and monthly surveys are undertaken of numbers animals (by sub-category) slaughtered and carcass weight (Cattle, sheep and pig slaughter). NIR 2015 applied a further evolution in data sources and method, whereby abbatoir data was linked with ear tag identification to provide a more precise estimate of carcass weight for dairy cows that had been slaughtered after their first calving (see inventory practice: estimating animal weights using carcass weight data). The carcass ratio was also updated based on a research study (Minchin et al. 2009).

Milk yield data is official data from DEFRA statistics. Annual data on fat content derives from the Rural Payments Agency responsible for administering payments related to milk supply adjusted for butterfat content, which required wholesale purchasers of milk to record butterfat content (The New Butterfat Adjustment Rules).

Earlier NIR submissions assumed digestibility (digestible energy as a percentage of GE) of 65% for dairy cows. NIR 2005 revised this estimate to 74.5%. The basis for this revision was an improved method for estimating cow energy requirements that was developed in 2004 to inform on-farm feed advice for dairy farmers (see Inventory Practice UK’s country-specific method for estimating digestibility). In brief, the new method is an energy balance approach to estimate the metabolizable energy (ME) requirement for a dairy cow. First, typical concentrate use by farmers derived from a farm survey published in 2008 is combined with the digestibility (DE as a % of GE) of concentrate feed based on the typical mix of protein and energy feed ingredients. From this, the annual ME requirement that has to be met from forage is derived. The composition of forage (i.e. fresh grass, grass silage, maize silage) is then estimated on the basis of expert opinion, taking into account the proportion of time spent at grazing by dairy cows and the amount of maize grown in the UK, and digestibility values for these forage components are taken from national feed tables. The resulting estimated digestibility of 74.5% has since been used in each annual submission but is not updated annually.

Table 3: Data sources used for Tier 2 estimate of enteric fermentation emissions from dairy cows

Model parameterData source in 2014Data source in 2017
Average live weightEstimated assuming annual growth of 1% from 1990 onwardsEstimated from slaughter weight data provided by annual commissioned study
Calf birth weight (kg)n.a.n.a.
Coefficient for maintenance (Cfi) IPCC default
% of time spent on pasture n.a.Various studies and surveys collated for estimating AWMS in manure management
Coeff. for feeding situation (Ca)IPCC default adjusted for proportion of time spent grazing/housedIPCC default adjusted for proportion of time spent grazing/housed
Annual milk yield (kg)DEFRA websiteDEFRA website
Average fat content (% fat)Rural Payments AgencyRural Payments Agency
% pregnant in the year n.a.n.a.
Coefficient for pregnancy (Cpreg) IPCC defaultIPCC default
DigestibilityIPCC defaultExpert judgment based on country-specific energy balance model
Gross energy (GE)CalculatedCalculated
Methane conversion factor (Ym)IPCC default (1996 GL)IPCC default (2006 GL)
Emission factorCalculatedCalculated

Note: n.a. indicates no information on data sources available

Beef cows: Initially, the UK lacked a time series of live weight data, so a constant live weight of 500 kg was assumed, and the resulting EF did not change from year to year. The calculated EF was close to the IPCC default, so initial submissions used the default value was used, but this was later replaced by the country-specific value. However, in NIR 2015, analysis of data for 2008-2012 from monthly abbatoir surveys on carcass weight data was combined with ear tag identification data to produce a more accurate estimate of carcass weight for beef cows that were slaughtered after their first calving (see inventory practice: estimating animal weights using carcass weigh data). A carcass ratio of 50% was applied to estimate live weight based on a scientific publication from a neighbouring country (Minchin et al. 2009). This analysis of abbatoir data is repeated annually to produce a time series for beef cow live weight. Other parameters, such as milk yield, milk fat content and digestibility, are assumed to be constant, so the time series of the EF now varies in relation to the estimated live weight of beef cows.

Table 4: Data sources used for Tier 2 estimate of enteric fermentation emissions from beef cows

Model parameterData source in 2014Data source in 2017
Average weightExpert judgementExpert judgement
Calf birth weight (kg)n.a.n.a.
Daily weight gain (kg/day)Expert judgementExpert judgement
Coefficient for maintenance (Cfi) IPCC defaultIPCC default
% of time spent on pasture Expert judgementVarious studies and surveys collated for estimating AWMS in manure management
Coeff. for feeding situation (Ca)IPCC default adjusted for proportion of time spent grazing/housed
Annual milk yield (kg)n.a.AFRC (1993)
Average fat content (% fat)n.a.n.a.
% pregnant in the year n.a.n.a.
Coefficient for pregnancy (Cpreg) IPCC defaultIPCC default
DigestibilityExpert judgement referring to national feed tablesExpert judgement referring to national feed tables
Gross energy (GE)CalculatedCalculated
Methane conversion factor (Ym)IPCC default (1996 GL)IPCC default (2006 GL)
Emission factorCalculatedCalculated

n.a. means description of data sources not available.

(2) Country-specific approach adopted in 2018

NIR 2018 adopts a country-specific methodology for enteric fermentation emission estimates from dairy and other cattle. In brief, the main features of the revised methodology are as follows:

Dairy cattle: Before 2018, the inventory represented only 1 dairy cow production system for the country, assuming a standard diet and average milk yield. The new methodology now represents 3 production systems based on breed, with breed- and region-specific data for milk yields and diet. This enables the inventory to capture changes such as increased use of forage maize. Research has established a close relationship between dry matter intake (DMI) and methane emissions, and DMI is now estimated on the basis of metabolizable energy which is determined using UK-specific energy balance equations as published in Feed into Milk (Thomas, 2004):

𝐶𝐻4_𝑒𝑛𝑡𝑒𝑟𝑖𝑐_𝑑𝑐 = (15.8185 × 𝐷𝑀𝐼) + 88.6002

Where:

CH4_enteric_dc is the enteric methane emission per dairy cow, g d-1

DMI is feed dry matter intake, kg d-1.

Calculations are performed at a monthly resolution, with characterization of production, management and feed by dairy cow category for each month.

Other cattle: Enteric methane emissions from other cattle, including dairy sector replacements and calves, and beef cattle, are estimated using the same approach as for dairy cows but with different relationships between enteric emission and dry matter intake. For non-lactating cattle:

𝐶𝐻4_𝑒𝑛𝑡𝑒𝑟𝑖𝑐_𝑜𝑐 = (17.5653 × 𝐷𝑀𝐼) + 45.8688

where

CH4_enteric_oc is the enteric methane emission per animal, g d-1.

For lactating suckler cows, the equation for dairy cows is used. For beef cattle, the inventory now represents 3 production systems (‘continental’, ‘lowland native’ and ‘upland’), with 6 roles and 16 age bands in each. Monthly numbers of animals in each system are provided by the cattle tracing system.

The revised inventory shows 6%-7% lower total agricultural emissions than previously estimated, but the trend in emissions between 1990 and 2015 is very similar. One benefit of adopting more advanced approaches in the 2018 inventory is that the inventory is now capable of presenting the effects of adopting GHG mitigation practices, such as change in diet or breeds.

Manure management (Methane)

Manure management methane emissions from cattle are a key category (NIR 2017).

Approach used: IPCC approach (T2 for cattle and swine), T1 for other livestock.

Implementation of the approach: The source of activity data on livestock populations is as described above for enteric fermentation. The emission factors for manure management are calculated following IPCC Tier 2 methodology using default IPCC data for volatile solids (VS) and methane producing potential (Bo) parameters for each livestock type, except for dairy and beef cows, where a Tier 2 calculation following IPCC 2006 Equation 10.24 is used to determine VS. In calculating VS, the country-specific estimates for DE% used for enteric fermentation and the IPCC default ash content (i.e. 8%) are used. With the 2018 methodological revision, DMI is estimated using the UK-specific metabolizable energy equations, and VS is estimated on the basis of the GE of feed and feed energy content.

Initially, country-specific data on the proportion of manure managed in the different manure management systems derived from a number of sources, including commissioned research that used postal surveys of farmers (Smith et al. 2000, 2001a, 2001b), expert opinion, and other available data. Since 2012, the Farm Practices Survey (an annual representative survey of 2500 farms implemented by DEFRA) has included questions covering adoption of GHG mitigation practices, including manure and slurry management. This data is now used in the estimation of proportion of manure managed in different management systems, and enables the inventory to reflect change in farming practices over time.

Uncertainty management

Until NIR 2015, the uncertainty associated with enteric fermentation and manure management was estimated using default estimates derived from the Watt Committee (i.e. ±20% for enteric fermentation and ±30.5% for methane emissions from manure management) (Williams, 1993). NIR 2015 used results of a DEFRA-commissioned study that provided improved estimates of uncertainty associated with livestock methane and nitrous oxide emissions (Milne et al. 2014). Monte Carlo simulation was applied to propagate the uncertainty from input variables to the IPCC Tier 2 models for dairy and beef cattle through to the resulting estimated aggregate emission estimate. The disaggregated input data provided by each of the UK’s devolved administrations was used, so the analysis provided geographically disaggregated insights into the main sources of uncertainty as well as identifying the contribution of GHG sources to uncertainty in the inventory. (see Inventory practice: Assessing uncertainty in the UK’s livestock inventory).


Resources

Milne AE, et al. 2014. Analysis of uncertainties in the estimates of nitrous oxide and methane emissions in the UK’s greenhouse gas inventory for agriculture. Atmospheric Environment.

Minchin W, et al. 2009. Prediction of cull cow carcass characteristics from live weight and body condition score measured pre-slaughter. Irish Journal of Agricultural and Food Research.

Misselbrook T. 2018. New UK agriculture GHG and ammonia inventories. Presentation to National Farmer’s Union.

Smith KA, et al. 2000. A survey of the production and use of animal manures in England and Wales. I. Pig manure. Soil Use and Management.

Smith KA, et al. 2001a. A survey of the production and use of animal manures in England and Wales. II. Poultry manure. Soil Use and Management.

Smith KA, et al. 2001b. A survey of the production and use of animal manures in England and Wales. III. Cattle manures. Soil Use and Management.

Williams A. 1993. Methane Emissions, Watt Committee Report Number 28, The Watt Committee on Energy, London.


Author: Andreas Wilkes, Values for development Ltd (2019)

Livestock country inventory: Sweden

Overview of Sweden’s current Tier 2 approach

The cattle industry in Sweden has, as in other developed countries, undergone large changes in structure and intensity in recent years. Numbers of dairy farms and animals have decreased, but the total production of milk has remained stable due to increasing milk production per cow. Today most farmers produce the forage for cattle feeding themselves but concentrates are often bought from feed companies. Changes have also occurred in feed evaluation and diet formulation methods.
Enteric fermentation emissions from dairy and non-dairy cattle, sheep and horses, and manure management methane emissions from non-dairy cattle are key categories in the national inventory. Sweden has used a country-specific Tier 2 approach for enteric fermentation from dairy and other cattle since the late 1990s. The approach used was updated in 2016. A Tier 1 approach is used for other livestock types (Table 1).

Table 1: Overview of Tiers used for livestock methane emissions in Sweden’s national GHG inventory

Livestock typesTier used for enteric fermentation (CH4)Year adopted*Tier used for manure management (CH4)Year adopted*
Dairy cattleT21990sT21990s
Non-dairy cattleT21990sT21990s
SheepT1-T1-
PigsT1-T21990s (later discontinued)
HorsesT1-T1-

*Year refers to the year of NC submission

Livestock characterization: Table 2 shows how livestock are categorized for estimation of different emission sources. Livestock population data comes from the Farm Register administered by the Swedish Board of Agriculture and Statistics Sweden. The register collects population data in mid-June of each year and this is taken to be the annual average. The Farm Register does not include data on the distribution of calves older and younger than 6 months. The inventory therefore assumes that 60% are younger than 6 months and the rest are over 6 months old.

Table 2. Livestock subgroups used in Sweden’s inventory

Categories according to IPCC GuidelinesSub-categories Enteric FermentationSub-categories Methane from manure managementSub-categories N2O from manure managementSub-categories N2O from grazing animals
Dairy CattleDairy cowsDairy cowsDairy cowsDairy cows
Non-Dairy CattleBeef cowsBeef cowsBeef cowsBeef cows
Other cattleGrowing animals (12-24 months)Growing animals (12-24 months)Growing animals (12-24 months)
Calves > 6 monthsCalves > 6 monthsCalves > 6 months
Calves < 6 monthsCalves < 6 monthsCalves < 6 months

Source: NIR 2003

Enteric fermentation

Sweden’s approach for enteric fermentation estimates has developed over time.

(1) 1990s and early 2000’s

In the 1990s and early 2000s, Sweden’s inventory used a country-specific methodology to estimate feed energy requirements and emission factors for cattle. The main difference with the IPCC model is that the Swedish model used metabolisable energy as opposed to gross energy intake. Furthermore, the energy loss through methane emissions is calculated as a fraction of digestible energy. This fraction is determined by total feed intake and digestibility of the feed, and therefore varies with diet, whereas the IPCC expresses feed energy content as a constant fraction of gross energy in feed.

The energy requirements for maintenance, growth, lactation and pregnancy are estimated in terms of metabolisable energy (MJ/day). This is then converted to digestible energy using an expression from Lindgren (1980):

Metabolisable energy (% of digestible energy) = 83,2 + 2,53*L 0,045 * G 0,184* Rp,

where L is the total feed intake expressed as a multiple of maintenance energy, G is the share (%) of roughage in the feed and Rp is the crude protein concentration (%) of the feed. Digestible energy is then used to calculate the methane conversion rate as:

Methane conversion rate (% methane in digestible energy) = 15,7 0,030 * SK 1,4 * L,

where SK is the digestibility of the feed (% of gross energy) and L is the total feed intake expressed as a multiple of maintenance energy. The emission factor can be calculated as:

Emission factor (kg CH4/head and year) = (DE * Ym 55,65) * 365

where DE is the digestible energy (MJ/head and day) and Ym is the methane conversion rate (% of digestible energy). For dairy cows the calculation is performed for a lactation period of 305 days and a non-lactating period of 60 days, which are summed to give the annual CH4 emission per animal.

To implement this methodology, milk yield data was used together with national feed tables to estimate the key parameters describing diet composition and quality. Data on milk yields came from the trade organisation Swedish Milk, as reported by their supplier farmers who use a production evaluation tool to optimize production. This database covers about 80% of dairy farmers. Farmers not linked to Swedish Milk are assumed to have a lower productivity because the main reason for keeping cows is not commercial production. Milk yield data were then used together with the national feed tables that underlie the production evaluation tool to estimate diet components and diet quality.

(3) 2017 onwards

In 2016, the Swedish Environmental Protection Agency commissioned a review of the inventory methodology for cattle enteric fermentation emissions by an expert at the Swedish University of Agricultural Sciences (Bertilsson, 2016). This revision considered that most feed farmers and advisers were by now using a specific software for cattle diet formulation, NorFor (http://www.norfor.info/; Volden, 2011). NorFor uses a net energy system rather than a metabolizable energy system, and its internal equations were developed on the basis of feed trials carried out over many years throughout Scandinavia. NorFor in fact automatically calculates enteric methane production from data input by farmers. For dairy cows, it uses an equation published by Nielsen et al. (2015):

CH4 (MJ/cow/day) = 1.39*DMI -0.091*FA

where

DMI = Dry Matter Intake, per cow and day
FA = Fatty Acids (g/kg DM in total feeds)

In the NorFor package GE is calculated according to Volden (2011). For the energy content in feed, a value of 18.4 MJ/kg DM is taken for grain-based concentrate, and 20.0 MJ/ kg DM for grass silage. The final value used depends on the proportions of concentrate and silage in the diet. For dairy cattle, feed consumption estimates are based on the recommendations in metabolisable energy as given in the national feed tables. The nutritional values of forages are according to data collected in the NorFor programme.

The live weight of cows is assumed to be 650 kg, based on research herds in the country. Average milk production is calculated from milk delivered to the dairies and on-farm consumption, i.e. total milk output divided by the number of dairy cows. Data on actual feeding practices are not widely available, so the inventory used the standard diets contained in web-based advisory packages that are widely used by farmers, as well as published surveys and others concerning feeding of cattle.
The values calculated (e.g. 141 kg CH4 head/year) were compared with values reported in nearby countries, such as Norway and Denmark.

Table 3. Data sources used in estimation of dairy cattle methane emissions

ParametersData sources
Number of dairy cowsFederation of Swedish farmers
Milk delivered to Swedish dairiesThe Swedish Board of Agriculture
On farm consumption (5.6%)Federation of Swedish farmers
Total milk production including home consumption Calculated
Milk, kg/cow/year Calculated
Fat,% Federation of Swedish farmers
Protein, %Federation of Swedish farmers
ECM, kg/cow/year Calculated
ECM, kg/cow/day Calculated
Total energy requirements, MJ ME for maintenance, milk production and pregnancy,
Per cow and day
National feed tables
Silage, MJ ME/kg DM National feed tables
Concentrate, MJ ME/kg DM Expert judgement
Silage fatty acids (FA), g/kg DM NorFor
Concentrate FA, g/kg DM NorFor
Forage proportion, %DM Expert judgement
MJ ME/kg total feeds in diet Calculated
FA, g/kg DM total feeds Calculated
Dry Matter Intake (total), kg DM/cow/day Calculated
MJ GE/cow/day Calculated
CH4, MJ/day Calculated
CH4, g/day Calculated
YM, %GE Calculated
CH4, kg/cow/year Calculated

Source: Sweden NIR 2017

Manure management

In the late 1990s, the IPCC Tier 2 methodology was applied to methane manure management emissions from cattle and pigs. The maximum methane production potential (Bo) and methane conversion factor (MCF) used IPCC default values, except for MCF for liquid manure, where a value of 10 % was adopted as it was considered to be more appropriate for Swedish conditions with its cold climate and because the slurry containers usually have a surface cover.

Data on manure production from cattle and pigs came from the Swedish Board of Agriculture, which had carried out large-scale experiments that determined the amount of manure produced per animal. The same value is used every year, except for dairy cattle, where manure production was assumed to be related to milk production, so the trend in manure production is extrapolated based on the trend in milk production.

Data on waste management systems derived from nationally representative surveys of fertilizer and animal manure used conducted by Statistics Sweden every two years. For intervening years, interpolated values are used.


(1) Lindgren 1980, Murphy 1992, Bertilsson 2001

(2) Spörndly 1999


Further Resources

Bertilsson J. 2016. Updating Swedish emission factors for cattle to be used for calculations of greenhouse gases. Report 292. Department of Animal Nutrition and Management. Swedish University of Agricultural Sciences

Lindgren E. 1980. Skattning av energiförluster i metan och urin hos idisslare (Estimates of energy losses in methane and urine for ruminant animals). Swedish University of Agricultural Sci-ences, Dept of livestock physiology, Report 47.

Murphy M. 1992. Växthusgasutsläpp från husdjur (Greenhouse gas emissions from livestock). Swedish Environmental Protection Agency. Report 4144.

Nielsen NI, Volden H, Åkerlind M, Brask M, Hellwing ALF, Stolen T, Bertilsson J. 2013. A prediction equation for enteric methane emission from dairy cows for use in NorFor, Acta Agriculturae Scandinavica, Section A — Animal Science, 63(3): 126-130, DOI: 10.1080/09064702.2013.851275.

Spörndly R. (ed). 2003. Fodertabeller för idisslare 2003 (Feed tables for ruminant animals). Swedish University of Agricultural Sciences. Department of Animal Nutrition and Management. Report 257.

Volden H. (Ed.). 2011. Norfor –the Nordic feed evaluation system. EAAP publication No. 130. Wageningen Academic Publishers, Wageningen, the Netherlands.


Author: Andreas Wilkes, Values for development Ltd (2019)

Livestock country inventory: New Zealand

Overview of New Zealand’s current Tier 2 approach

Grassland-based animal husbandry makes major contributions to New Zealand’s economy, and production practices and productivity have changed considerably in recent decades. Key categories in the latest inventory include enteric fermentation emissions from dairy cattle, non-dairy cattle, sheep and deer; manure management methane emissions from dairy cattle, and direct N2O emissions from urine and dung deposited by grazing animals (NIR 2017). New Zealand currently reports emissions from dairy and non-dairy cattle, sheep and deer using Tier 2 approaches (Table 1). A country-specific Tier 1 emission factor is used for goats and the IPCC default is used for pigs, as these emission sources are not significant. New Zealand began using a country-specific Tier 2 approach for livestock enteric fermentation in the early 1990s. Initially, static emission factors were used that did not change along with changes in production practices or animal performance. Since 2003, a full Tier 2 approach has been adopted in which enteric fermentation emissions per head per year vary according to changes in production practice and animal performance.

Table 1: Overview of Tiers used for livestock methane emissions in New Zealand’s national GHG inventories

Livestock typesTier used for enteric fermentation (CH4)Year adopted*Tier used for manure management (CH4)Year adopted*
Dairy cowsT22003T22006
Beef cattleT22003T22006
SheepT22003T22006
GoatsCS T11994T1-
DeerT22003T22006
PigsT1-T1-

*Year refers to the year of NIR submission

Enteric fermentation

Approach used: Since 2003, New Zealand has used country-specific approaches to estimate enteric fermentation emissions from the major ruminant livestock categories. Because country-specific data and monthly data intervals are used for livestock populations, productivity and pasture quality, the approach may be considered to be close to a Tier 3 methodology.

How the approach has developed over time: New Zealand’s livestock emissions inventory has undergone three distinct phases of development.

(1) 1994 2001: Tier 1/ Tier 2 approach

Even before the IPCC 1996 Guidelines were released, New Zealand was reporting livestock emissions using a country-specific approach similar to the approaches later set out in the IPCC Guidelines. In 1990, the Ministry for the Environment commissioned an inventory of enteric methane emissions (Ulyatt et al. 1991). The resulting inventory estimated methane emissions as:

Methane output = livestock number x intake x emission per kg of intake

To implement this, the commissioned study used national statistics on livestock populations together with a livestock population model to estimate the number of animals in sub-categories of each type of ruminant on a monthly time-step by accounting for births, deaths, the month of slaughter and age. Feed intake was estimated for four separate regions of the country to account for differences in pasture quality in different climatic regions (defined on the basis of temperature and rainfall distribution) and for three pasture types within each region (i.e., improved, unimproved, tussock). Published and unpublished data and expert opinion were used to characterize the energy density and chemical composition of the diet consumed in each month by each sub-category of livestock. Dry matter intake was estimated on the basis of energy requirements and the data on diet quality. Methane emissions per unit of dry matter intake were then estimated using a theoretical model of rumen digestion (Baldwin et al. 1987).

When the inventory model developed by Ulyatt et al. (1991) was incorporated into the national GHG inventory, however, a simplified approach was used in which:

methane output = livestock number x methane emission factor

where the methane emission factor was taken from the study by Ulyatt et al. (1991). Thus, while the Ulyatt et al. (1991) method was a Tier 2 approach, the national inventory used a Tier 1 approach with a country-specific emission factor that remained fixed over time.

In 2001, a review was commissioned to assess the conformity of the inventory approach to the IPCC 1996 Guidelines and to suggest recommendations for improving the inventory. The main findings of the review (Clark, 2001) included the following:

  • Use of a fixed emission factor resulted in underestimation of emissions, because changes in animal performance were not reflected in the emission factor. A comparison for 1998 of the official inventory estimates and an inventory using methane emission factors adjusted for productivity gains indicated underestimation by official inventory by about 7%.
  • The Baldwin model gave estimates of methane output per unit of feed intake of around 7.5% of gross energy, compared to 6% of gross energy for country-specific experimental data and the IPCC default value.
  • The contribution to accuracy of dividing the country into climatic regions was limited, whereas if the country were divided into regions based on industry definitions, animal performance data would be readily available and could be more frequently updated.
  • Areas of non-conformity with the IPCC Guidelines included the use of a Tier 1 approach in the national inventory when livestock emissions were among the key source categories; lack of transparent documentation of the inventory methods used; and lack of uncertainty analysis.
(2) 2003 2008: developing and implementing a Tier 2 Tier 3 approach

Following the 2001 review, a revised inventory model was developed that differed from the former approach in five main respects:

(i) The revised model did not use fixed emission factors but calculated emissions using a monthly time step model containing data on livestock numbers, livestock performance and diet quality.
(ii) The input data on livestock performance characteristics change each year in line with published industry and government information, thus accounting for changes in livestock productivity.
(iii) Data on direct measurements of methane emissions from ruminants collected in New Zealand were used to estimate the conversion of energy intake to methane output.
(iv) The size of the errors in the inventory were assessed using Monte Carlo analysis; and
(v) The inventory method was transparently documented (Clark et al. 2003).

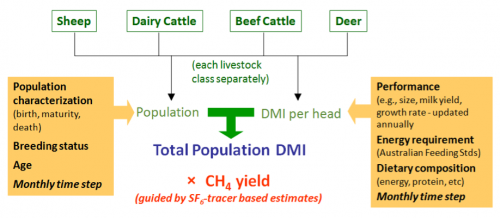
The overall approach is summarized in Figure 1.

Figure 1: Overall approach in New Zealand’s revised Tier 2 inventory approach
Source: NIR (2007)

For each type of ruminant (dairy cattle, beef cattle, sheep and deer), a population model incorporating births, deaths and slaughter, was developed to estimate the number of animals in each sub-category, including numbers of pregnant and lactating animals on a monthly basis. Livestock productivity data was used along with a model of energy requirements and data on dietary composition of forage and feed to estimate monthly dry matter intake per head for each sub-category of animal. Because of a lack of routine representative surveys in the country, the best available data was used. The same data sources were used in each year, so that even though there are uncertainties around the values used each year, the uncertainties are likely to be consistent, and a time series that reflects changing farming practices is provided. Data sources and values were transparently documented, so that the values used could be incrementally improved over time.

To estimate DMI for each sub-category, the energy required to meet the assumed levels of performance (MJ metabolisable energy (ME) per day) was divided by the energy concentration of the diet consumed (MJ ME per kg dry matter). To estimate energy requirements, an Australian model (CSIRO 1990) was used in preference to IPCC or other models because the Australian model had been developed specifically for grazing animals, which more closely reflects New Zealand’s predominant production practices. Monthly data on the ME value of forage from scientific publications was entered into the model, assuming the same monthly values for all years, as there was no historical time series.

To convert energy intake into methane output, none of the existing published models were judged to be appropriate. However, since 1996 SF6 tracer techniques had been used to measure methane emissions in New Zealand, and by 2003 New Zealand had one of the largest datasets of methane emission measurements under grazing conditions. For the initial revised inventory, the averages of existing published and unpublished measurements for different types of animal were used.

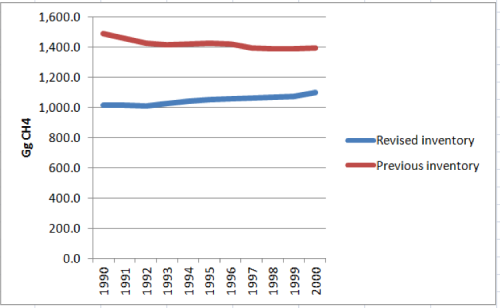
Using the revised inventory model, enteric fermentation emissions were estimated for 1990-2000. The estimate for 1990 submitted in NIR 2003 was 47% lower than in the previously submitted inventory estimates for that year (Figure 2). And while the previous inventory had shown a decreasing trend in total enteric fermentation emissions, the revised inventory showed a lower, but increasing trend. The resulting re-estimate of the trend in enteric fermentation emissions was of great significance, as at that time New Zealand was preparing for the first commitment period of the Kyoto Protocol.

Figure 2: Trend in enteric fermentation emissions (1990-2000) using the initial and revised inventory approaches
Source: NIR 2003

(3) 2009 present: continuous improvement of Tier 2 Tier 3 approach

Since 2009, the structure and overall approach used in the national inventory has largely remained unchanged. Improvements have focused on improving the accuracy of inventory estimates, improvements in operational efficiency, and improvements in inventory quality. To facilitate regularization of the continual improvement process, in 2009 an Agricultural Inventory Advisory Panel was established consisting of representatives of the Ministry for Primary Industries (MPI) and Ministry for the Environment, which together are responsible for the inventory compilation and reporting; research institutes; and experts on methane and nitrous oxide emissions. The panel provides advice on proposed changes to the agricultural section of the national GHG inventory on the basis of peer reviewed reports and papers (see Inventory Practice: New Zealand Advisory Panel).

For livestock emission sources in the inventory, significant changes have included the following: (1)

Regionalization of dairy sector emissions: Before 2010, CH4 and N2O emissions from ruminants were disaggregated by species and sub-categories of animal based on age and breeding status but not by region. This was because (a) the 2001 inventory review (Clark, 2001) indicated that disaggregating the inventory by climatic region led to identical results to a simpler national model; and (b) some key data (e.g. animal weight, animal performance) was not available on a regional level for all species. However, for dairy cattle, a time series of regionally disaggregated data on dairy cattle populations, live weight, milk yield and milk fat and protein contents were available. Moreover, emissions from the dairy sector had increased from 25% of total agricultural emissions in 1990 to almost 40% of agricultural emissions in 2006, and the regional structure of the sector had changed considerably, suggesting that a single national model may no longer be the most accurate way of estimating GHG emissions from the sector. A comparison of national emission estimates based on a single national model and the aggregation of 17 sub-national estimates indicated that a regional approach has little impact on 1990 emission estimates but reduced estimates for 2006 by 2.3%. The regionalized approach for the dairy sector was adopted in NIR 2010.

Improvements in animal live weight estimates: New Zealand’s methane emissions model estimates emissions on the basis of estimated energy and feed intakes. Since most energy consumed by breeding animals is used for maintenance, animal live weight is closely related to energy and feed intake estimates. Feed intake is estimated on the basis of live weight, but estimation of live weight in the inventory model is done using data on carcass weight and an assumed carcass ratio (i.e. dressing out percentage). A review of the national inventory model (Muir et al. 2008) suggested that the ewe and beef cow carcass or live weight estimates and carcass ratios used in the model were based on limited data and assumptions that might lead to significant errors in the inventory estimates. A review of the best available published and unpublished data and collection of new primary data led to a revision of the time series for live weight estimates for ewes and beef cows. (See Inventory Practice: Improved Estimates of Live Weight in New Zealand).

Adjustments to animal population models: Data on the total population of each livestock type in New Zealand is available, but the inventory uses a population model to estimate the change in the populations of sub-categories of each type based on age and breeding status. The estimated sub-populations are not directly verifiable. Therefore it is important to check the suitability of the assumptions used in the model. A review of the population model was commissioned, which led to recommendations to revise various assumptions, such as the dates of lambing calving and slaughter for certain sub-categories, mortality rates and average age at slaughter. These adjustments were recommended on the basis of the best available data. In addition, improvements have been made to the software used for inventory compilation and to the procedures for error checking and recalculation.

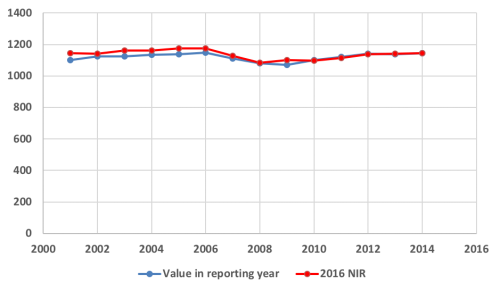
These adjustments and the resulting recalculations have led to marginal changes in estimated total emissions (Figure 3).

Figure 3: Comparison of total enteric fermentation emissions in NIR 2016 submission and previous submissions
Source: H. Clark (2018)

Manure management (Methane)

Manure management methane emissions from dairy cattle are a key category in the national inventory (NIR 2017).

Approach used: Because most livestock production in the country is grazing-based, whereas other approaches are more suited to systems involving storage of manure since 2006 a country-specific approach to estimating manure management methane emissions has been used. Since NIR 2015, for methane from dairy effluent in anaerobic lagoons, the equations in the IPCC 2006 Guidelines have been used.

Description of approach: The country-specific approach is based on methods recommended by Saggar et al. (2003) in a review commissioned by the Ministry of Agriculture and Forestry. The approach involves:

1. estimating the total quantity of excreta produced,
2. partitioning the excreta between that deposited directly onto pastures and that stored in anaerobic lagoons; and
3. applying country-specific emission factors for the quantity of methane produced per unit of faecal dry matter produced.

Faecal dry matter output is calculated monthly for each species subcategory as:

FDM = DMI × (1-DMD)

Where:

FDM = faecal dry matter output
DMI = dry matter intake
DMD = dry matter digestibility
DMI and DMD are the same as in the enteric methane inventory, and:
M = (FDM × MMS) × Ym

where:

M = methane from manure management
FDM = faecal dry matter output
MMS = proportion of faecal material deposited on pasture
Ym = country specific methane yield methane yield (g CH4 per year)

95 % of excreta from dairy cattle and all excreta from other ruminants is deposited directly on pastures. Values for Ym for excreta deposited on pastures for sheep and cattle are obtained from country-specific measurement studies. For deer, there have been no specific measurements, so the mean of cattle and sheep values is used. As improvements in the national inventory have been implemented (e.g. changes in livestock performance parameters, regionalization of the dairy inventory), these changes have been incorporated into the data used to estimate manure management methane emissions.

Only 5% of dairy cattle manure is stored in anaerobic lagoon waste systems, for which the method adopted from 2006-2015 was as follows:

M = (FDM × MMS) × W/1000/d × Ym

Where:

M = methane from manure management
MMS = proportion of faecal material deposited on pasture
W = water dilution rate (litres per kg faecal dry matter)
d = average depth of a lagoon (metres)
Ym = methane yield (g CH4 per m2 per year)

The method adopted assumed that all faeces deposited in lagoons are diluted with 90 litres of water per kilogram of dung dry matter, which gives the total volume of effluent stored (NIR 2008). Published reports estimated annual CH4 emissions as 0.33–6.21 kg CH4/m2/year from anaerobic lagoons in New Zealand, and the mean value is assumed in the inventory. From NIR 2015, this method was replaced by the IPCC 2006 Tier 2 equations in response to criticism of the country-specific methodology in scientific papers published by New Zealand researchers and a review commissioned by MPI (Pratt et al. 2012).

Uncertainty management

Prior to revision of the inventory approach in 2003, New Zealand’s inventory submissions did not provide a quantitative estimate of uncertainty. Uncertainty assessment was conducted as part of revision of the livestock inventory, and was reported in the 2003 NIR submission. The assessment used Monte Carlo analysis to assess the uncertainties in predicted outputs (i.e. dry matter intake and methane emissions) and to determine confidence intervals around the estimated output values. This analysis was implemented in a specialized software package, @RISK. In Monte Carlo analysis, input parameters that are subject to uncertainty (in this case, energy intake, energy concentration in the diet, the quantity of methane produced per unit of intake and the number of animals) are described as probability distributions rather than single values. The model is then run thousands of times, with a new value for each input parameter sampled from within its probability distribution. The resulting estimated emissions thus reflect the range of assumed variability in the input parameters. The contribution of each input parameter to uncertainty in the output estimates is then quantified using regression analysis.

Initially, analysis was applied to the inventory years 1990 and 1998. Results estimated uncertainty in methane emissions of 23.5% (Clark et al. 2003). It also showed that the 95% confidence intervals for 1990 and all subsequent years overlap, so that from a statistical perspective, it was not certain that emissions had actually changed since 1990. Analysis also showed that uncertainty in methane emissions was dominated by the uncertainty in the methane per unit of intake, with smaller contributions from uncertainties in the estimates of energy requirements and pasture quality. Therefore, reducing uncertainties in methane emissions per unit of intake would have the greatest contribution to reducing uncertainty in the overall livestock methane inventory.

In subsequent years, the uncertainty of the annual estimate was calculated using the 95% confidence interval from the Monte Carlo simulation as a percentage of the mean value, i.e. in 2001, the uncertainty in annual emissions was ± 53% (Table 2). The uncertainty in annual estimated livestock methane emissions was about 12% of total national emissions, and was the largest source of uncertainty in the whole inventory. However, assuming that uncertainty between years is correlated, the contribution of livestock methane emissions to uncertainty in the trend in emissions was only about 2.4%.

Table 2: Uncertainty in the annual estimate of enteric fermentation emissions for 1990, 2001 and 2005 estimated using Monte Carlo simulation (1990, 2001) and the 95% confidence interval (2005)

Enteric methane emissions (Gg/year)95% CI minimum95% CI maximum
19901015.5478.11552.9
20011099.4517.61681.2
20051139.0536.21741.8

Source: NIR 2007

In 2009, the Ministry of Agriculture and Forestry commissioned a new study to recalculate the uncertainty of the enteric fermentation methane emissions for sheep and cattle (Kelliher et al. 2009). Since the uncertainty analysis in 2003, a larger number of experimental estimates of feed intake and methane yield was available (529 in 2009, compared to 50 used in the 2003 analysis), providing an opportunity to re-estimate uncertainty in the inventory. In addition to estimating uncertainty in total methane emissions, the study also addressed other questions, such as the relationship between age of sheep or cattle and methane yield. It concluded that there were no statistically significant differences between methane yields of sheep or cattle of different ages, and estimated the number of additional methane yield experiments and measurements that would be required to reduce uncertainty in the livestock methane inventory by 1%. Overall uncertainty in the livestock methane inventory was estimated at 16%. Thus, uncertainty analysis contributed not only to producing a new estimate of total uncertainty in the inventory, but also improvements in methods for uncertainty analysis, providing guidance on input data values, and support to refining future inventory improvement activities.


(1) Clark. 2018. Key steps and requirements in moving to an advanced inventory: Experience from New Zealand.


Further Resources

NIR 2003 New Zealand’s Greenhouse Gas Inventory 1990-2001. Ministry of Environment.

NIR 2007 New Zealand’s Greenhouse Gas Inventory 1990-2005. Ministry of Environment.

NIR 2008 New Zealand’s Greenhouse Gas Inventory 1990-2006. Ministry of Environment.

NIR 2017 New Zealand’s Greenhouse Gas Inventory 1990-2015. Ministry of Environment.

Baldwin et al. 1987. Metabolism of the Lactating Cow. ll Digestive Elements of a Mechanistic Model. Journal of Dairy Research, 54: 107-131

Clark H. 2001. Ruminant Methane Emissions: a Review of the Methodology used for National Inventory Estimations. A Report Prepared for the Ministry of Agriculture and Forestry by AgResearch Ltd.

Clark et al. 2003. Enteric methane emissions from New Zealand ruminants 1990–2001 calculated using an IPCC Tier 2 approach. Report prepared for the Ministry of Agriculture and Forestry.

Clark. 2018. Key steps and requirements in moving to an advanced inventory: Experience from New Zealand. PowerPoint presentation.

CSIRO. 1990. Feeding Standards for Australian Livestock: Ruminants. Australian Agricultural Council. Ruminants Sub Committee. CSIRO Publications, East Melbourne, Australia.

Kelliher, et al. 2009. Reducing uncertainty of the enteric methane emissions inventory. MAF Technical Paper. [Download]

Muir, et al. 2008. Better estimation of national ewe and beef cow liveweights. MAF Technical Paper. [Download]

Pratt C, et al. 2012. Revised methane emission factors and parameters for dairy effluent ponds – Final Report. Landcare Research.

Saggar S, et al. 2003. Methane emissions from animal dung and waste management systems, and its contribution to national budget. Landcare Research Contract Report: LC0301/02. Prepared for the Ministry of Agriculture and Forestry: New Zealand.

Ulyatt MJ, et al. 1991. Methane Production by Ruminants. A Report Prepared for the Ministry of the Environment by DSIR Grasslands, June 1991.


Author: Andreas Wilkes, Values for development Ltd (2019)

Livestock country inventory: The Netherlands

Overview of The Netherlands‘ current Tier 3 and 2 approach

The Netherlands has a strong history in agriculture. Livestock (dairy, swine and poultry), horticulture and arable farming are still major sub-sectors in the country’s economy. Key categories in the country’s latest inventory include enteric fermentation from dairy cattle, growing cattle and swine. For manure management, methane emissions from cattle, swine and poultry, and N2O emissions from manure management (direct and indirect following atmospheric deposition of NH3 and NOx) are key sources. In the Netherlands, methane emissions from enteric fermentation are primarily caused by cattle (89%), followed by swine (6%) and other livestock categories (sheep, goats and horses, 5%).

A country-specific Tier 3 approach is used for enteric fermentation emissions from dairy cattle. A country-specific Tier 2 approach is used for growing and non-dairy cattle, while for all other livestock categories a Tier 1 approach is used and default IPCC emission factors are applied.

Table 1: Tiered approaches used for livestock in the national GHG inventory

Livestock typesTier used for enteric fermentation (CH4)Year adopted*Tier used for manure management (CH4)Year adopted*
Dairy cattleT32006T2Before 2003
Growing cattleT2Before 2003T2Before 2003
Non-dairy cattleT2Before 2003T2Before 2003
PoultryNEBefore 2003T2Before 2003
PigsT1Before 2003T2Before 2003
Other livestock categoriesT1Before 2003T1Before 2003

*Year refers to the year of NIR submission, NE=not estimated

Livestock population data originate from the yearly Agricultural census. The census distinguishes a number of livestock categories (Table 2).

Table 2: Livestock categorization method

Mature dairy cattle2 categories based on region within The Netherlands (Northwest/Southeast)
Mature non-dairy cattle1 category
Growing cattle14 categories based on production purpose (replacement or fattening) and age
Swine6 categories based on age and physiological status
Poultry9 categories differentiated by production purpose (laying hen or broiler) and age
Sheep2 categories: ewes and other
Goats2 categories: milk goats and other
Horses4 categories: horses and ponies for agriculture or private use
Other animalsMules and asses, rabbits (does/meat), minks and foxes

Source: Vonk et al. 2018

Enteric fermentation emissions from cattle

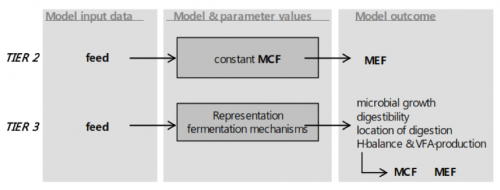
A Tier 3 approach for mature dairy cattle uses a mechanistic, dynamic model representing fermentation mechanisms in the rumen. Rather than assuming rumen CH4 production, the model predicts CH4 production based on the effect of nutrition on microbial activity, volatile fatty acid (VFA) production and hydrogen surplus. By estimating methane production directly, the model clearly differentiates from other model approaches and calculation methods, and from the Tier 2 approach which uses a fixed methane conversion factor (Figure 1).

The model calculates (i) gross energy (GE) intake, (ii) CH4 EF (in kg CH4/cow/year) and (iii) the methane conversion factor (Ym; % of GE intake converted into CH4) on the basis of data on:

  • The share of feed components (grass silage, maize silage, wet by-products and concentrates);
  • the chemical composition of feed components (soluble carbohydrates (including sugars), starch, cell walls (hemi-cellulose, cellulose and lignin), crude protein, crude fat and crude ash);
  • rumen intrinsic degradation characteristics of starch, crude protein and fibre.

Due to differences in rations between the Northwest (rations mainly grass-based) and Southeast of the country (large share of maize silage) calculations for these regions are made separately.

Figure 1. Schematic representation of the difference between Tier 2 and Tier 3 approaches (MCF = Methane Conversion Factor, MEF = Methane Emission Factor)

Source: Bannink 2011

For other mature cattle and growing cattle categories, enteric fermentation emissions are calculated by multiplying the gross energy intake with a methane conversion factor (Ym). As the production of white veal calves is an important sub-sector in The Netherlands, and considering the large share of milk products in their ration, in this case a country-specific Ym value is used. For all other cattle types (young cattle and mature non-dairy cattle) the IPCC 2006 default Ym is used.

Gross energy intake is based on rations calculated by the Working Group on Uniformity of calculations of Manure and Mineral data (in Dutch ‘Werkgroep Uniformering berekening Mest- en mineralencijfers’, WUM). Changes in GE intake are based on changes in both the total feed intake and the share of feed components.

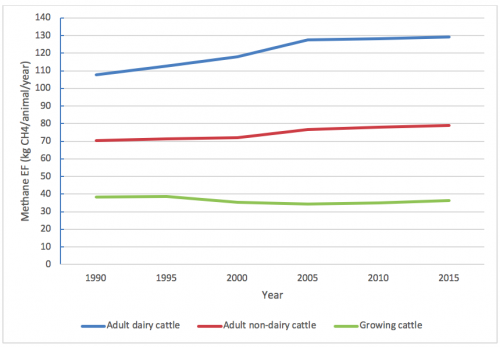
Since 1990, there have been continuous increases in feed intake (20%), level of milk production (34%) and CH4 emission (17%), resulting in a continued reduction of CH4 per kg of fat- and protein-corrected milk (13%) (Bannink 2011). An increase in total feed intake has increased the emission factor over time, however a change in nutrient composition, contributing to (among others) feed digestibility has partly offset the increase in emission factor. An overview of emission factors for methane emissions from enteric fermentation is provided in Figure 2.

Figure 2. Methane emission factors for cattle (1990-2015)

Source: Netherlands NIR 2017

Inventory compilation

The following data is collected:

  • the number of dairy cows;
  • registered national milk production;
  • a weighed yearly average of feed intake;
  • a weighed yearly average of diet composition;
  • data on feed analysis and chemical composition of forages, and the composition of concentrates feeds.

Data on nutrition and dairy performance are delivered by the Working Group on Uniformity of calculations of Manure and Mineral data (WUM) on a yearly basis. Data is collected and aggregated by a team under the coordination of Statistics Netherlands (CBS).

Data on the chemical composition of roughages (grass herbage, grass silage, maize silage) are provided by Eurofins Agro, the main commercial laboratory for such in The Netherlands. The chemical composition of roughages from many farms is analysed as part of the Dutch manure policy; farmers in The Netherlands are obliged to demonstrate the mineral management on their farm, including the composition of their roughages (through fixed amounts or by analysis).

Data on the type, amount and chemical composition of by-products and concentrates fed to dairy cattle are collected by CBS by consultation with the feed industry and use of feed tables.

How the approach has developed over time: from Tier 2 to Tier 3 (2006)

The Netherlands began using a country-specific Tier 3 approach for dairy cattle in 2006 to be able to justify a lower CH4 conversion factor than the average default value with the relatively high nutritional quality of Dutch dairy diets. At that time, the IPCC guidelines for a Tier 2 approach applied a default CH4 conversion factor of 6.5% of gross energy (GE) intake. This value appeared relatively high for Dutch conditions. Furthermore, using a constant conversion factor did not reflect variation in level of feed intake, feed digestibility and the composition and quality of the ration. A dynamic, mechanistic model to account for this variation was available already (Mills et al., 2001) and was adapted with an improved representation of the production of volatile fatty acids (Bannink et al. 2000; 2006); a crucial element for prediction of hydrogen balance and CH4 formation. Therefore, the Netherlands revised its method in 2005 by using this dynamic, mechanistic model as a country-specific Tier 3 approach from 2006 onwards.

The model is derived from the rumen fermentation model developed by Dijkstra et al. (1992) and extensively evaluated by Neal et al. (1992) and Bannink et al. (1997). The model, initially developed to model the fermentation process in the rumen, appeared to be suitable for methane modeling as well, and offered the opportunity to take more detailed ration composition and quality into account. The model thus enabled more precise methane emission estimations; each aspect of the model is based on scientific research. Evaluation studies by Neal et al. (1992) and Bannink et al. (1997) indicated the need to revise the representation of the amount and type of VFA as end-product of rumen fermentation. Subsequently, a database of in vivo data from lactating cows was developed and analyzed by Bannink et al. (2000; 2006). Mills et al. (2001) adapted the model by adding coefficients for digestion in the small intestine and a mechanistic, adding a dynamic, mechanistic module for microbial activity in the large intestine, and adding calculation of hydrogen balance in rumen and large intestine and CH4 formation. An updated version with a representation of VFA formation that is dependent on digesta acidity, applied as a Tier 3 approach was described by Bannink et al. (2011).

Revised feed intake, milk production and ration composition data for the years 1990 until 2007 (2009)

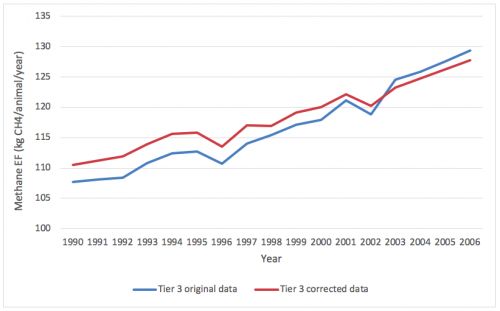
In 2009 revisions were made to derive input data on feed intake, ration composition and milk production figures from 1990 until 2007. Revisions included (i) inclusion of feed losses (of roughages, concentrates and by-products), (ii) an increase of the net energy requirement for maintenance and (iii) a correction for the ammonia-N fraction of N in crude protein (Bannink, 2011). Calculations of the methane emissions from enteric fermentation from dairy cows were subsequently revised. Results of the corrections are displayed in Figure 3.

In 2016, a slight modification was introduced to let the model apparent fecal N digestibility and excretion urine or ammoniacal N more accurately. This modification had negligible effects on predicted CH4 emissions however (a 0.03% higher CH4 emission factor; results not shown).

Figure 3. Recalculated methane EF for dairy cattle with revised input data

Source: adapted from Bannink 2011

Methane emissions from manure management

Manure management methane emissions from cattle, swine and poultry are a key category in the national inventory (NIR) and calculated using a country-specific Tier 2 approach. Methane emissions from manure are mainly caused by fermentation of organic matter in an anaerobic environment. As methanogenic bacteria take some time to produce methane, methane from manure stored for less than a month is very low. The conversion of organic matter in methane also depends on manure composition and environmental factors such as temperature. Methane emissions are calculated for liquid and solid manure management systems and, where applicable, also for manure produced on pasture land whilst grazing.

Manure management methane emission estimates are directly related to calculations done for methane emissions from enteric fermentation, as key input data consist of the amount of volatile solids (VS) produced per animal, which are again based on feed intake, composition and VS digestibility. The amount of volatile solids excreted by livestock depends on the digestibility of the organic matter and protein content of the feed. Data on feedstuffs and rations are used to provide this information (Zom & Groenestein, 2015).

Manure management methane emissions are calculated by multiplying the volatile solids excretion (VS, in kg) with the maximum methane production potential (BO, in m3 CH4/kg VS) and the methane conversion factor, which is based on the manure management conditions.
For all other livestock categories emissions are estimated using a Tier 1 approach (Vonk et al. 2018).

Uncertainty management

The uncertainty for each aspect of the rumen fermentation model used to calculate methane emissions from enteric fermentation, is estimated by experts. Since revisions to derive input data were done in 2009, and calculations were corrected in 2011, the estimated uncertainty for annual emissions from dairy cattle was corrected from 20 to 16%.

Until 2017, a 5% uncertainty level for livestock population data was used, while for the emission factor an uncertainty level of 15% was employed (combining to 16% overall uncertainty).
In the recently published update of the methodology for estimating emissions from agriculture in The Netherlands, a revised uncertainty level for mature dairy cattle of 15% is described, based on a new estimate of uncertainty of 2% for the total animal population. Furthermore, uncertainty levels are disaggregated for the Northwest and Southeast of The Netherlands, with an uncertainty of 21% for the split emission factor, and 3.4 and 2.4% for the activity data, respectively.

For other mature cattle, growing cattle, swine and other livestock categories, uncertainty levels are 21, 11, 41 and 44.5% respectively (Vonk et al. 2018).


Further Resources

Bannink A. 2011. Methane emissions from enteric fermentation by dairy cows, 1990-2008; Background document on the calculation method and uncertainty analysis for the Dutch National Inventory Report on Greenhouse Gas Emissions. Wageningen, Statutory Research Tasks Unit for Nature and the Environment.

Bannink A, van Schijndel MW, Dijkstra J. 2011. A Model of Enteric Fermentation in Dairy Cows to Estimate Methane Emission for the Dutch National Inventory Report Using the IPCC Tier 3 Approach. Animal Feed Science and Technology.

Bannink A, De Visser H, Van Vuuren AM. 1997. Comparison and evaluation of mechanistic rumen models. British Journal of Nutrition.

Dijkstra J, Neal HD StC, Beever DE, France J. 1992. Simulation of nutrient digestion, absorption and outflow in the rumen: model description. Journal of Nutrition.

Mills JAN, Dijkstra J, Bannink A, Cammell SB, Kebreab E, France J. 2001. A mechanistic model of whole-tract digestion and methanogenesis in the lactating dairy cow: model development, evaluation, and application. Journal of Animal Science.

Neal HD StC, Dijkstra J, Gill M. 1992. Simulation of nutrient digestion, absorption and outflow in the rumen: model evaluation. Journal of Nutrition.

NIR. 2017. Greenhouse gas emissions in The Netherlands 1990 2015 National Inventory Report 2017. RIVM Report 2017-0033.

Vonk J,  et al. 2018. Methodology for estimating emissions from agriculture in the Netherlands update 2018. Calculations of CH4, NH3, N2O, NOx, PM10, PM2.5 and CO2 with the National Emission Model for Agriculture (NEMA). Wageningen, The Statutory Research Tasks Unit for Nature and the Environment (WOT Natuur & Milieu). WOt-technical report.

Zom RLG and Groenestein CM. 2015. Excretion of volatile solids by livestock to calculate methane production from manure. TC-O_20. In: RAMIRAN 2015 16th International Conference Rural-Urban Symbiosis. Proceedings Book. 8th 10th September 2015, Hamburg University of Technology, Germany.


Author: Andreas Wilkes, Values for development Ltd (2019)

Livestock country inventory: Ireland

Overview of Ireland’s current Tier 2 approach

About 90% of Ireland’s agricultural land area is used for grazing or hay and grass silage production. Livestock products account for more than half of the agricultural economy and make major contributions to exports. Until 2006, Ireland’s GHG inventory used a Tier 1 approach for all livestock emission sources. Enteric fermentation from cattle and sheep, and cattle manure management are key emission sources. Since 2006 a country-specific Tier 2 approach has been used for enteric fermentation and manure management emissions from cattle.

Table 1: Overview of Tiers used for livestock methane emissions in Ireland’s national GHG inventories

Livestock typesTier used for enteric fermentation (CH4)Year adopted*Tier used for manure management (CH4)Year adopted*
Dairy cattleT22006T22006
Non-dairy cattleT22006T22006
SheepT1-T1-
PigsT1-T1-
Other livestockT1-T1-

*Year refers to the year of NIR submission

Enteric fermentation

Approach used: Ireland’s Tier 2 approach was developed through a commissioned study conducted by the Irish Government under the National Development Plan 2000–2006 (1). The structure of the inventory and quantification approach was specifically designed to capture the diversity of Ireland’s grass-fed cattle production systems and to make use of existing energy balance models used by extension services and farmers in the country.

Livestock characterization and population data: Livestock census data collected by the Central Statistics Office (CSO) categorize the Irish cattle herd into 11 main categories (Table 2). The country was divided into three geographic regions based on slurry storage requirements of local planning authorities and coinciding with the regions used for implementation of nitrogen pollution control measures pursuant to the EU Nitrates Directive. In each region, the length of winter housing and feeding practices vary. Because the CSO livestock statistics do not report numbers for each region, the number of cows in each region was obtained from the Cattle Movement and Monitoring System (CMMS). The total number of cows in the CMMS and CSO data differ, so the proportion of animals in each region in the CMMS data were applied to the total population reported by CSO. Emission factors were calculated for each of the 11 animal categories in each of the 3 regions, and a weighted average across the regions calculated for reporting in the inventory. The CSO undertakes two censuses of animal numbers each year (June, December), and for dairy cows and suckler cows, the average number in each category in June and December is used.

Table 2: Classifications for cattle used in Ireland’s national inventory

Cattle typeClassification
Breeding cattleDairy cowsSuckler (beef cows)
Beef cattleMale <1 year
Female <1 year
Male 1-2 years
Female 1-2 years
Male >2 years
Female >2 years
Other cattleBreeding bullsDairy in-calf heifersBeef in-calf heifers

Estimation of gross energy intake: For estimation of gross energy intake, Ireland uses a system based on the French energy system (INRA 1989). For each animal type in each region, cattle production systems were characterized in terms of calving date, the dates of winter housing and spring turn-out to grass, milk yield and composition, forage and concentrate feeding level, cow live-weight and live-weight change, and lactation period. Based on these characteristics, the daily energy requirement of cows in each region is calculated by month, including requirements for maintenance, milk yield and composition, fetal growth, and gain or loss of bodyweight.

In the INRA system, net energy requirement is defined in terms of Unites Fourragere Lait (UFL), where 1 UFL is the net energy value of 1 kg of barley at 86% dry matter and is equal to 7.11 MJ net energy for lactation (NEl). (For growing beef cattle, net energy requirements are also determined using the same UFL as for dairy, but for finishing cattle, 1 UFV is the net energy value of 1 kg of barley for meat production and is equal to 7.61 MJ NEmg). For dairy cattle, the main equations used in estimation are:

  1. Maintenance NEl requirements (MJ) = 9.96 + (0.6 x LW/100), where LW is live-weight. A 10% activity allowance is added for the housed period and a 20 % allowance is added for the grazing period;
  2. NEl (MJ) required per kg milk = 0.376 * fat content + 0.209 * protein content + 0.948;
  3. Pregnancy: mean of 12.1 MJ NEl /day for the last 3 months of pregnancy;
  4. Live-weight change: each kg live-weight lost contributes 24.9 MJ NEl to energy requirements, while each kg of live-weight gained requires 32 MJ NEl.

The live weight of 535 kg for dairy cows was estimated by the Department of Agriculture, Food and the Marine. The composition of the diet of cows in each region was described on a monthly basis, and daily intake was calculated by reference to the daily energy requirement. In estimating diet composition, the concentrate allowance was fixed while forage intake varied according to energy requirements.

Daily methane emissions (MJ/day) were calculated from digestible energy intake using the equation of Yan et al. (2000):

CH4 = DEI * [ 0.096 + (0.035 x SDMI/TDMI) ] 2.298 * (FL 1)

where DEI is digestible energy intake (MJ/day), SDMI and TDMI are silage and total dry matter intakes (kg/day), respectively, and FL is feeding level (multiples of the maintenance energy requirement).

A constant methane conversion rate of 0.065 of gross energy intake is applied when the diet consists of grazed grass and 3 kg or less of concentrate supplement per day. This is based on a large New Zealand database of measurements for grazing animals on similar production systems to those in Ireland. Daily CH4 emissions are summed to give annual emissions for cows in each region, and a weighted national average emission factor is then calculated.

For beef cattle, emissions are determined by calculating lifetime emissions for the animal and by partitioning between the first, second and third years of the animal’s life. This approach allows the published CSO animal population census for June to be used directly as the activity data most representative of the inventory year for enteric fermentation while taking into account the movement of cattle from one age category to another (i.e. from 0-1 year old to 1-2 year old to over 2 years old), as enumerated by the June census, up to two times in their three-year lifetime. The most important parameter for beef cattle is live-weight gain, as it directly affects the energy requirement and thus the feed intake. Live-weight gain of different types of cattle was estimated by applying carcass weight of slaughtered cattle from government statistics to the various life stages of each animal category, such that when all categories are combined, that data is consistent with the national statistics for carcass weight (plus or minus 10 kg). Estimation of emissions from beef cattle was directly calculated using the software INRAtion, which is based on the French energy system.

As a result, the emission factors for dairy cattle reported in the NIR vary year to year by tracking milk yield. For other cattle types, the national emission factors vary depending on the average proportion of each animal type in the three regions.

Manure management: The Farm Facilities Survey (Hyde et al. 2008) provides detailed data on manure management practices to support the adoption of a Tier 2 method for estimating methane emissions from manure management. The Farm Facilities Survey was conducted on a representative sample of farms, the results of which are available at both national level and for each of the three designated Nitrates Directive regions. The partitioning of the year into pasture and housing periods is based on expert opinion in conjunction with the results of the Farm Facilities Survey for each production system identified in the inventory. Having derived the time spent at pasture and the time spent in housing for cattle, the Farm Facilities Survey is used to determine the partitioning of liquid and solid manures to manure management systems within the housing period, and the estimation of the number of animals that are out-wintered (i.e. at pasture all year round). The analysis of feeding regime used to estimate enteric fermentation was also used to estimate the excretion of organic matter by cattle. The methane production potential (BO) of manure, and the methane conversion factor (MCF) use the IPCC default values.

Improvements over time: Since the initial adoption of a Tier 2 approach for cattle, Ireland has used the same approach in its inventory. The Department of Agriculture, Food and the Marine has funded the establishment of The Agricultural Greenhouse Gas Research initiative for Ireland (AGRI-I). This is an organizational and collaborative framework designed to: build a critical mass of scientific expertise in GHG research, co-ordinate uniform measurement protocols, and address a specific set of research issues. The AGRI-I network has a specific set of research aims, primarily focussed on the inclusion of validated GHG emissions mitigation strategies into the national inventory. This research includes a review of feed intake parameters and assumed nitrogen content of feeds and updates as necessary. A separate but related research project investigated the development of country specific BO and MCF values using a range of cattle manures and environmental conditions. In addition the EPA has funded a research project aimed at reviewing the Tier 2 methodology used for the estimation of CH4 emissions from cattle.


(1) O’Mara. 2007. Development of emission factors for the Irish Cattle Herd.


Resources

O’Mara. 2007. Development of emission factors for the Irish Cattle Herd

Hyde et al. 2008. an extensive Farm Facilities (Manure Management) Survey.

INRA. 1989. Ruminant Nutrition. Recommended Allowances and Feed Tables. Jarrige, R. (ed.). John Libbey Eurotext, London and Paris.


Author: Andreas Wilkes, Values for development Ltd (2019)

Livestock country inventory: India

Overview of India’s current Tier 2 approach

India’s livestock sector is one of the largest in the world, with more than half of the world’s buffalo, more than 10% of all cattle and more than 20% of small ruminants. Livestock has multiple functions in rural livelihoods, and with increasing income and urbanization, demand for animal products is gradually increasing. India’s first and second national communications reported that in 1994 and 2000, enteric fermentation and manure management emissions totaled just over 200,000 GgCO2 (accounting for about 60% of total agricultural emissions).

India has used a country-specific Tier 2 approach for cattle and small ruminant enteric fermentation emissions since submitting its first national communication in 2004, although the specific method used has changed over time, as described in the second national communication (2012). Methane emissions from manure management are not a key category in the inventory and are estimated using a Tier 1 approach, although applications of the Tier 2 approach have been reported in sources used in the national inventory.

Table 1: Overview of Tiers used for livestock methane emissions in India’s national GHG inventories

Livestock typesTier used for enteric fermentation (CH4)Year adopted*Tier used for manure management (CH4)Year adopted*
Dairy cattleT22004T1-
Non-dairy cattleT22004T1-
Dairy buffaloT22004T1-
Non-dairy buffaloT22004T1-
SheepT22012T1-
GoatsT22012T1-
Other livestockT1-T1-

*Year refers to the year of NC submission

Enteric fermentation

How India’s approach has developed over time:

(1) First national communication

In its first national communication, submitted in 1994, India reported emission factors for cattle and buffalo based on the weighted average of emission factors derived through different methods. Cattle and buffalo were divided by breed type, use and age (Table 2). Emission factors were estimated using the IPCC method, by collating published methane emission estimates and by a number of direct measurements using the face mask technique carried out as part of the enabling activities in preparation for the compilation of the national communication. Livestock population data derived from the livestock census.

Table 2: Emission factors for different livestock types reported in India’s first national communication

CategoryEmission factor (kgCH4/head/year)
Dairy cattle
Indigenous28±5
Cross-bred43±5
Non-dairy cattle (indigenous)
0-1 year9±3
1-3 year23±8
Adult32±6
Non-dairy cattle (cross-bred)
0-1 year11±3
1-2.5 year26±5
Adult33±4
Dairy buffalo50±17
Non-dairy buffalo
0-1 year8±3
1-3 year22±6
Adult44±11

(2) Second national communication

The methodology used in the second national communication is described in a scientific journal publication by Swamy and Bhattacharya (2006). The estimation of gross energy intake is based on dry matter feed intake as stipulated in the Indian Feeding Standards. After defining sub-categories of cattle and buffalo, the annual average live weight for each sub-category was estimated based on national scientific publications. Gross energy intake was estimated as:

GE (MJ) = (TDNc X 4.4 X 4.184 X 365)/(DE/100)

where TDN is total digestible nutrients from the Indian feeding tables. For breeding animals, this included TDN required for maintenance, lactation and pregnancy, while for other animals it includes TDN for maintenance and work.

The researchers who developed this method suggested that a methodology based on Indian feeding standards was more appropriate for estimating gross energy intake than the IPCC method. The Indian feeding standards have been widely accepted within India. They recommend feed rations on the basis of TDN and ME values, and compared to the NRC method are more strongly supported by studies on the nutrition of tropical animals.

Having estimated GE intake for each category of animal, a methane conversion factor was applied to GE intake for each category. The methane conversion factors used were based on IPCC default values but adjusted for younger animal groups based on national research.

In the national inventory, this approach is applied to livestock data at the state level. National level implied emission factors are then the weighted average of emission factors across the country.


Further Resources

India 2004. First national communication.

India 2012. Second national communication.

Swamy M. 2016. AFOLU Emissions. Version 1.0 dated July 15, 2016, from GHG platform India: GHG platform India-2007-2012 National Estimates 2016 Series.

Swamy M, Bhattacharya S. 2006. Budgeting anthropogenic greenhouse gas emission from Indian livestock using country-specific emission coefficients. Current Science.


Author: Andreas Wilkes, Values for development Ltd (2019)