
Livestock country inventory: Japan

Overview of Japan’s current Tier 2 approach

Total emissions from enteric fermentation was identified as a key category in Japan’s 1990 inventory, and are still a key category in the latest inventory submission (NIR 2018). Nitrous oxide from manure management, but not methane from manure management, is a key category. Japan reports enteric fermentation emissions from dairy and non-dairy cattle using a Tier 2 approach. A Tier 1 approach is used for enteric fermentation from all other livestock types. Methane emissions from manure management are estimated using a Tier 2 approach with a combination of country-specific and default emission factors, depending on the manure management system. Japan’s specific approach adopted for both enteric fermentation and manure management methane emissions has evolved over time.

Table 1: Overview of Tiers used for livestock methane emissions in Japan’s national GHG inventories

Livestock typesTier used for enteric fermentation (CH4)Year adoptedTier used for manure management (CH4)Year adopted
Dairy cowsT2mid-1990sT1/T21990s
Non-dairy cowsT2mid-1990sT1/T21990s
PigsCS T1*early 1990sT1/T21990s
BuffaloT1-T1-
SheepT1-T1-
GoatsT1-T1-
HorsesT1-T1-

*Tier 1 approach with country-specific emission factor.

Enteric fermentation

Approach used: Country-specific model.

Why was this approach adopted? Following the IPCC Guidelines, Japan adopted a Tier 2 approach, but decided to follow the common practices in Japanese livestock research of estimating emission factors on the basis of dry matter intake.

Description of approach: Japan’s country-specific model is based on a relationship between emissions and dry matter intake (DMI). The approach has evolved over time through changes in livestock categorization and methods used to estimate DMI of different cattle sub-categories.
Research published in the early 1990s (Shibata et al. 1993) showed that for ruminants the volume of methane emitted per head per day could be related to dry matter intake using the equation:

Y = -17.766 + 42.793X 0.489X2

where Y is the volume of methane generated (liters/day) and X is dry matter intake (kg/day). Japan’s inventory continues to use this equation.

Emission factors for each type of animal are estimated using average dry matter intake as recorded in the Japan Feed Standards, which is compiled by the Japan Livestock Industry Association. In the feed standards, DMI is estimated using an equation based on fat corrected milk yield, body weight, and daily weight gain by daily growth, where fat corrected milk is updated on the basis of annual official statistics. In 2006 and 2008, the equations used to estimate DMI of different sub-categories were updated for dairy and non-dairy cattle, respectively (Table 2).

Table 2: Equations used to estimate DMI by cattle in Japan
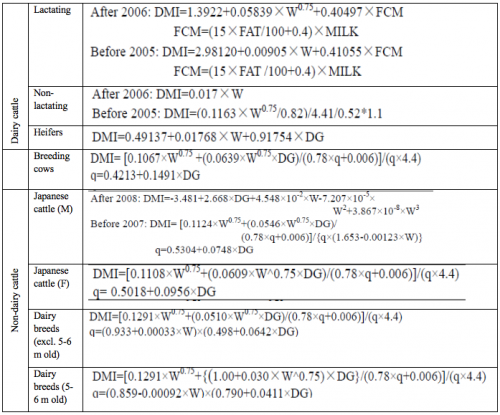
W: weight, FCM: fat corrected milk, FAT: fat content of milk, MILK: Milk yield, DG: daily growth, q: energy metabolic rate.
Source: NIR 2012

Livestock population numbers for each type of cattle come from official statistics documented in a survey at 1 February each year by the Ministry of Agriculture, Forestry and Fisheries. Initially, inventory sub-categories included 3 types of dairy cattle (lactating, dry and heifers) and 4 types of non-dairy cattle (breeding cows, fattening cattle <1 year and >1 year old, and dairy breeding animals). The inventory excluded cattle under 6 months old, which were assumed to account for 50% of the population of cattle categories under 1 year old. Subsequently, 5 and 6 month old cattle were identified as a separate sub-category, and fattening cattle were divided into male and female sub-groups of different ages and sub-groups defined by breed (NIR 2006). An inventory review in 2016 pointed out that cattle over 3 months old emit methane, and in NIR 2017, calves between 3 and 6 months were added as another sub-category.

Table 3: Emission factors for cattle in Japan’s national inventory
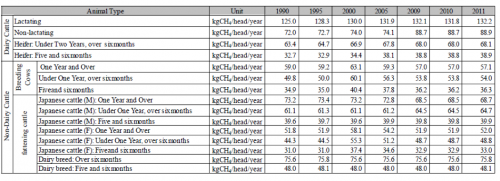
Source: NIR 2012

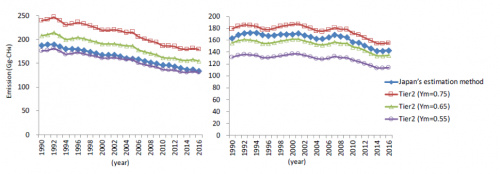
Japan has undertaken studies to compare the results of estimation using its country-specific approach and the IPCC model. Using available national data and IPCC default values for Ym, Cfi and Cpregnancy, enteric fermentation emissions were estimated using the IPCC model. The results show that there are no significant differences between the estimates made using the two approaches (Figure 1).

Figure 1: Comparison of results of Japan’s country-specific estimation method and IPCC Tier 2 method for dairy cattle (left) and non-dairy cattle (right)
Source: NIR 2018.

Manure management (Methane)

In its early inventories, manure management methane emissions from cattle, pigs and poultry were estimated using measurements conducted on different manure management systems in Japan (JLTA 1999; JLTA 2002; Fukumoto et al. 2001). Subsequently, a mixed approach was adopted whereby national emission factors were used if there was reliable data, and IPCC default values were used if appropriate EFs from other countries were not available (see Inventory Practice: Choice of emission factors in Japan). EFs established using Japanese research are based on direct measurements, and the use of country-specific values has increased over time. For example, NIR 2018 uses country-specific values for the methane EFs from pit storage and biogas digesters. This was based on actual measurements in 9 regions of the country using the floating chamber method (MAFF 2012). The integrated EF for the country is the average of regional EFs weighted by the dairy cattle population in the country (NIR 2018).

Table 4: Manure methane emission factors for cattle, pigs and poultry in Japan’s inventory
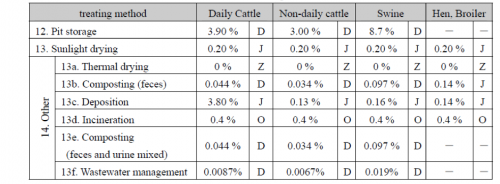
Note: D = IPCC default; J = Japan; O = other countries; Z = not applicable.
Source: NIR 2006

Data on the proportion of animal waste managed in different systems derived from different sources. In 1997, a survey was conducted prior to enforcement of the “Act on the Appropriate Treatment and Promotion of Utilization of Livestock Manure”. This act prohibits inappropriate manure management practices and induced changes in the proportion of manure managed in different systems. A second survey was conducted in 2009, and data for years between 1997 and 2009 were interpolated. From 2009 onwards, results of an annual national survey conducted by MAFF have been used.

Uncertainty management

For cattle, the uncertainties of emission factors were calculated by finding the 95% confidence interval in accordance with the equation used to estimate the emission factors (Dairy cattle: -26% to +32%, non-dairy cattle: -40% to +49%). Populations of cattle (activity data) are based on data from the official Livestock Statistics, but standard error for cattle is not described in the official statistics. Therefore, the uncertainties for activity data were substituted by 1% error estimated for swine in the Livestock Statistics. As a result, the uncertainties of the emissions were determined to be -26% to +32% for dairy cattle and -40% to +49% for non-dairy cattle.

The uncertainties for emission factors of livestock other than swine were applied the 50% default data given in the 2006 IPCC Guidelines. For the uncertainty for activity data of swine, 1% of standard error for swine given in the official Livestock Statistics is applied. For activity data for livestock other than swine, uncertainty was substituted by the value for broilers (9%) described in the Livestock Statistics. As a result, the uncertainties of the emissions were determined to be -72% to +157% for swine and 51% for buffalo, sheep and goats and horses.


Further Resources

Y. Fukumoto, et al. 2001. Measurement of NH3, N2O and CH4 emissions from swine manure composting using a new dynamic chamber system, Proceedings of 1st IWA International Conference on Odor and VOCs Measurement, Regulation and Control techniques. Australia pp 613-620.

Japan Livestock Technology Association, GHGs emissions control in livestock Summary, March 2002

Japan Livestock Technology Association, GHGs emissions control in livestock Part4, March 1999

Ministry of Agriculture, Forestry and Fisheries of Japan, the Project on Survey and Investigation for Elaboration of GHG Emissions from Agriculture, Forest and Fisheries Sector, within the Project on Development for Method of Promotion for Countermeasures of Global Environment in the Agriculture, Forest and Fisheries Sector in FY2011, 2012.

Shibata, Terada, Kurihara, Nishida, Iwasaki. 1993. Estimation of Methane Production in Ruminants. Animal Sciences and Technology.


Author: Andreas Wilkes, Values for development Ltd (2019)
Livestock country inventory: Estonia

Overview of Estonia’s current Tier 2 approach

Although the total population of livestock has been decreasing since 1990, enteric fermentation from cattle is a key source in the national inventory, accounting for about 95% of methane emissions from livestock (NIR 2017). Manure management methane emissions from dairy cattle are a key category by trend. Estonia began using a Tier 2 approach for cattle enteric fermentation emissions in 2007, and subsequently adopted Tier 2 approaches for manure management methane emissions and methane emissions from pigs in 2010 (Table 1).

Table 1: Overview of Tiers used for livestock methane emissions in Estonia’s national GHG inventories

Livestock typesTier used for enteric fermentation (CH4)Year adopted*Tier used for manure management (CH4)Year adopted*
Dairy cattleT22007T22010
Non-dairy cattleT22007T22010
SheepT1-T1-
PigsT22010T22010
OtherT1-T1-

*Year refers to the year of NIR submission

Enteric fermentation

Description of approach: Estonia implements the IPCC Tier 2 model for cattle. The approach estimates daily gross energy (GE) intake on the basis of animal performance, management practices and environmental factors. GE is converted to methane using a methane conversion factor (Ym), and estimated daily emissions are multiplied by number of days to make an estimate of annual emissions per head. Activity data on the population of livestock of each category are multiplied by the EF to estimate total annual emissions from enteric fermentation for that category of livestock.

Implementation of the approach:

Activity data: Livestock population data is provided each year by Statistics Estonia, which provides population data for each of the 11 counties in the country. Initially, emissions were separately estimated for dairy cattle and 4 other types of cattle in each county (Table 2). Subsequently, a review recommended separate calculations for calves <6 months old, which are now estimated as 50% of the population of calves <1 years old. In 2017, the former method of calculating emissions by county and aggregating results to national level was replaced by a single calculation at national level using the weighted average of activity data from the counties.

Table 2: Livestock categorization in Estonia’s Tier 2 approach

Sub-categoriesRegions
NIR 2010Dairy: mature female
Non-dairy: mature female, mature male, steers, calves <1 year old
11 countries
NIR 2017Cattle >2 years old: dairy cattle, non-dairy mature females, non-dairy mature males
Cattle 1-2 years old
Calves 6-12 months old
Calves 0-6 months old
1 calculation at country level using weighted average of activity data from sub-regions

Estimation of emission factors: Table 3 shows the sources of data used when Estonia first applied the Tier 2 approach (2007) to dairy and other cattle and the sources used in its most recent inventory submission (2017). Estonia’s initial Tier 2 approach for cattle used a mixture of IPCC default values and national statistical data:

  • Apart from the standard coefficients in the IPCC model, default values were used for live weight, feed digestibility and the methane conversion factor.
  • Subsequently, national data for cattle live weight was obtained from the Estonian Animal Recording Centre (EARC), which also provided data on milk fat content and % of cows giving birth in each year. The EARC collects animal performance data on dairy cattle by breed. A weighted average of live weights is estimated and used as the estimate of live weight in the national inventory.
  • The initial estimate of feed digestibility was from the IPCC guidelines. Subsequently, a scientific publication from the country was used as the data source (Kaasik et al. 2002).

For dairy cattle, data on cattle weight, milk yield and fat content, and the % of cows giving birth are updated annually on the basis of data obtained from statistics agencies and the animal recording centre. Estimated GE and EFs thus vary year to year. For non-dairy cattle, live weight estimates, which are derived from IPCC default values and national research, do not vary from year to year.

Table 3: Data sources used for Tier 2 estimate of enteric fermentation emissions for dairy cattle in Estonia

Model parameterData source in 2007Data source in 2017
Average live weightIPCC 1996EARC
Daily weight gain (kg)Literature from own countryEARC
Coefficient for maintenance (Cfi)IPCC 1996IPCC 2006 GL
% of time spent on pasture-*-*
Coeff. for feeding situation (Ca)IPCC 1996IPCC 2006 GL
Annual milk yield (kg)Statistics EstoniaStatistics Estonia
Average fat content (% fat)EARCEARC
% pregnant in the yearEARCEARC
Coefficient for pregnancy (Cpreg)IPCC 1996IPCC 2006 GL
Digestible energy (%DE)IPCC 1996Literature from own country
Gross energy (GE)CalculatedCalculated
Methane conversion factor (Ym)IPCC 1996IPCC 2006 GL
Emission factorCalculatedCalculated

* indicates no data source cited.
Source: NIR 2007, NIR 2017

Manure management (Methane)

Approach used: IPCC approach (T2 for cattle and swine), T1 for other livestock.

Implementation of the approach: Livestock population data are taken from national statistics, using the same sources as are used for enteric fermentation. In Estonia’s initial Tier 2 approach for methane emissions from cattle manure management, the default values from the IPCC 1996 Guidelines (Reference Manual) were used for all parameters. Estonia continues to use default values for ash content, the maximum amount of methane able to be produced from that manure (Bo) and the methane conversion factor (MCF). Country-specific data are now used for feed digestibility, and the proportion of manure managed in different systems is estimated using expert judgement to replace the IPCC default MMS values.

Table 4: Data sources used for Tier 2 estimate of methane emissions from manure management in Estonia

Model parameterData source in 2010Data source in 2017
GECalculatedCalculated
%DEIPCC 1996 defaultsLiterature from own country
Ash contentIPCC 1996 defaultsIPCC 2006 defaults
BoIPCC 1996 defaultsIPCC 2006 defaults for E Europe
Proportion of manure managed in different systems (MMS)IPCC 1996 defaultsExpert opinion from Estonian Environmental Research Centre
MCFIPCC 1996 defaultsIPCC 2006 defaults

Uncertainty management

Estonia has no country-specific estimates of the uncertainty rates of activity data. Estimates were obtained from an Austrian publication (Rypdal & Winiwarter, 2001), where uncertainties of livestock population data from Austria, Norway, the Netherlands and USA are presented. Estonia assumes activity data uncertainty is the same as the Austrian uncertainty estimate. Uncertainty of emission factors is estimated using the IPCC default values.

Table 5: Estimated uncertainty values in Estonia’s livestock inventory

InputUncertaintyReference
Activity data
Livestock populations±10%Rypdal and Winiwarter, 2001
Emission factors
Enteric fermentation (cattle, pigs)±20%IPCC 2006 Vol 4 Ch 10, p.10.33
Enteric fermentation (sheep, goats, horses, fur animals)±40%

Source: Estonia NIR 2017


Further Resources

Kassik A, et al. 2002. Nutrient losses (N, P, K) in dairy-and pig production. Journal of Agricultural Science.

Rypdal K, Winiwarter W. 2001. Uncertainties in greenhouse gas emission inventories—evaluation, comparability and implications. Environmental Science & Policy.


Author: Andreas Wilkes, Values for development Ltd (2019)
Livestock country inventory: Denmark

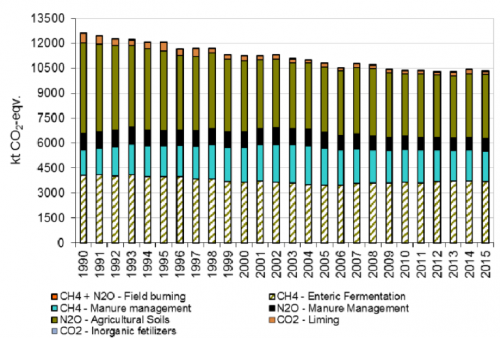
The agriculture sector in Denmark contributes 21% of the country’s overall GHG emissions, excluding LULUCF. Denmark’s agriculture emissions are dominated by the livestock sector, primarily due to the production of dairy and non-dairy cattle and swine. Methane (CH4) is the largest contributor to the overall agricultural emissions, accounting for 54% of the sector’s CO2-equivalents in 2015 (Figure 1).

Figure 1. Greenhouse gas (GHG) emissions by the agriculture sector from 1990 2015 (1)

Source: Denmark NIR 2017

Overview of Denmark’s current Tier 2 approach

Denmark adopted the IPCC Tier 2 approach for cattle enteric fermentation in the 1990s. In 2003, a thorough revision of the inventory methodology was undertaken, leading to extension of the Tier 2 approach to other animal types and adoption of a country-specific refinement to the IPCC Tier 2 approach.

Table 1: Tiered approaches used for livestock in Denmark’s national GHG inventory

Livestock typesTier used for enteric fermentation (CH4)Year adopted*Tier used for manure management (CH4)Year adopted*
Dairy cattleT2Before 2003T2Before 2003
Non-dairy cattleT2Before 2003T2Before 2003
SheepT22004T22004
PigsT22004T22004
Other (horses, goats, deer)T2variousT2Various

*Year refers to the year of NIR submission

Table 2: Livestock categorization method

Dairy cattleNon-dairy cattleSwine
35 categories based on animal type (defined by age, physiological status, breed) and housing system129 categories based on animal type (defined by age, physiological status, breed) and housing system 3 categories: sows, weaners, fattening pigs

Calculation of enteric fermentation emissions from cattle

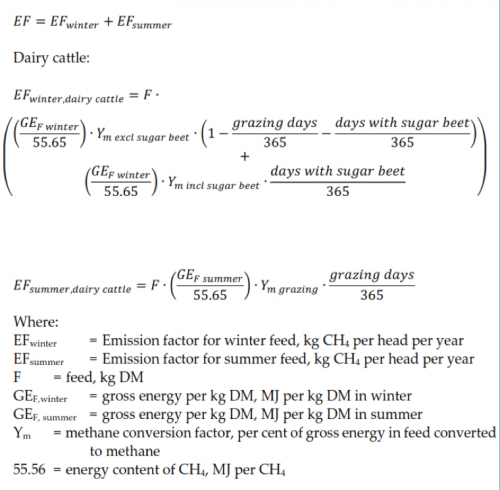
Emissions from enteric fermentation are calculated using a methodology based on 2006 IPCC Guidelines. A Tier 2 approach is used for all ruminants and swine. Calculations for cattle are based on the sum of emissions in the winter and summer feeding seasons (Figure 2). During the summer the ration mainly consists of grass, whereas during the winter roughage and concentrate feeds are fed. The equations for dairy cattle used to specifically include sugar beets in the winter ration, which result in higher methane emissions. However, in recent years sugar beet production in Denmark has declined significantly and they are no longer a major part of the feed ration.

Figure 2. Denmark’s equation for emission factor calculation for dairy cattle

Source: Denmark’s NIR 2017

Calculation of gross energy per kg DM relies on the Danish Normative System. The Danish Normative System is used for fertilizer planning and control by Danish famers and authorities (Poulsen et al. 2001; Poulsen 2016). The Danish normative standards are based on practical farming and thus reflect actual Danish agricultural production characteristics. The normative standards are developed annually by the Danish Centre for Food and Agriculture (DCA) on the basis of data received from SEGES, which is the central office for all Danish agricultural advisory services. SEGES collects efficacy reports from Danish farmers, to optimize productivity in Danish agriculture, as well as conducting other research.

In the dairy sector, 10% of the Danish farmers are part of an intensive monitoring system. Four to five times a year, detailed data including livestock numbers, animal weight and feeding plans (e.g. rations, nutrient content) is collected. This includes any feed bought from outside the farm. Furthermore, 50% of the Danish farmers participate in an annual monitoring system, which includes ‘spot’ samples on feeding plans. Data collected from the 50% of farmers are compared with the 10% farmers who are monitored in greater detail and more intensively. This comparison serves data verification purposes and gives an indication of whether the 10% can serve as ‘model farmers’ for the normative system. Based on the very detailed production data, normative standards are then established. In total the normative standards cover feed plans from 15-18% of the Danish dairy production. Previously, the normative standards were updated and published every third or fourth year. Since 2001 these standards have been updated annually and are available to download from the homepage of DCA.

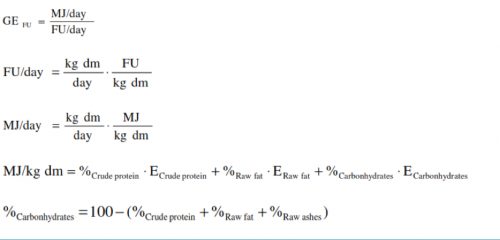
To calculate the total gross energy (GE) intake, the GE per kg DM (GFF) or GE per feed unit (GEFU) is estimated. A feed unit in Denmark is defined as the feed value in 1.00 kg barley with a dry matter content of 85%. For other cereals, e.g. wheat and rye, one feed unit is 0.97 kg and 1.05 kg, respectively.

For dairy cattle, gross energy intake is estimated by DCA, based on detailed data from feeding plans as collected annually by SEGES. From 2014 feed intake for dairy cattle given in the normative figures are given in kg DM per year and the energy in the feed is given in MJ per kg DM. The energy intake is a standard winter feed regardless of whether the animal grazes or not. For all livestock categories other than dairy cattle, the estimation of gross energy (GEFU) is based on the composition of feed intake and the energy content in proteins, fats and carbohydrates based on feeding controls or actual feeding plans at farm level, collected by SEGES or DCA. In contrast to dairy feed data, this feeding data is collected every 3 to 4 years. The data are given in Danish feed units or kg feedstuff and these values are converted to mega joule (MJ):

Source: Denmark NIR 2017

Feeding data collected by SEGES have shown a shift in feeding practices from sugar beets to maize (whole cereal). Due to the higher content of easily convertible sugar, sugar beets resulted in higher methane emissions than maize or grass. This change in feeding practices is reflected in the average methane conversion factor (Table 3).

Table 3: Development of Denmark’s methane conversion rate (Ym) for dairy cattle and heifers > 0.5 years between 1990 and 2015 (%)

19901991199520002002 2015
Ym incl. sugar beet6.706.706.456.136.00
Ym excl. sugar beet6.006.006.006.006.00
Ym grazing6.006.006.006.006.00
Ym average6.386.386.246.076.00

Source: Denmark’s NIR 2017

The estimation of the national methane conversion factors is based on the model ‘Karoline’ developed by DCA and is based on the average feeding plans obtained from SEGES (Olesen et al. 2005). Initially, DCA estimated methane emissions for a winter feeding plan for two years, 1991 (Ym=6.7) and 2002 (Ym=6.0) and estimated Ym for the years between 1991 and 2002 using interpolation. New measurements by Hellwing et al. (2014) resulted in new methane conversion factors of between 5.98 and 6.13.

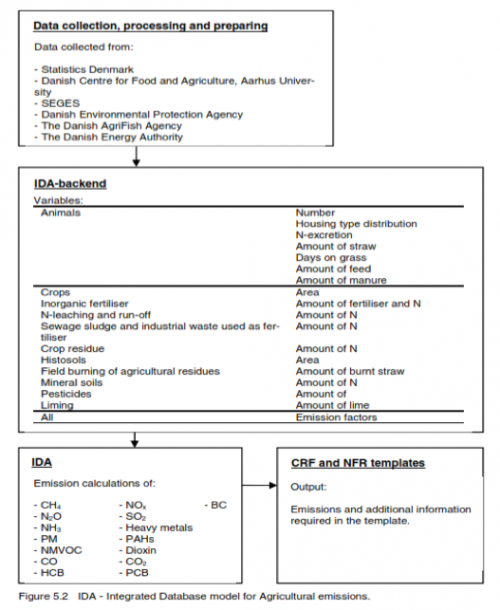
Figure 3: Integrated database model for agricultural emissions, Denmark

Source: Denmark NIR 2017

Manure management emissions

The emissions from the agricultural sector are calculated in a comprehensive agricultural model complex called IDA (Integrated Database model for Agricultural emissions, Figure 3). The model is designed in a relational database system (MS Access). Input data are stored in tables in one database called IDA Backend and the calculations are carried out as queries in another linked database called IDA. This model complex is implemented in great detail and is used to cover emissions of air pollutants and greenhouse gases. There is therefore a direct coherence between input data used to estimate enteric fermentation and manure management methane emissions, as well as between this and the data used to estimate ammonia (NH3) and N2O emissions.

Most emissions relate to livestock production, which is based on information on the number of animals, the distribution of animals according to housing type and information on feed consumption and excretion. IDA operates with 39 different livestock categories, according to livestock type, weight class and age. These categories are subdivided into housing type and manure type, which results in 269 different combinations of livestock sub-categories and housing types. For each of these combinations, information on feed intake, digestibility, excretion, grazing days and other parameters is included. The emission is calculated from each of these subcategories and then aggregated in accordance with the IPCC livestock source categories given in the Common Reporting Formats.

Roles and responsibilities in inventory compilation

Activity data and emission factors are collected and discussed in cooperation with specialists and researchers in various institutes with agricultural expertise, including SEGES, DCA, Aarhus University and Statistics Denmark. An overview of key institutes and organizations involved in Denmark’s agriculture emission inventory, and key data/information collected is provided in Table 4.
The Danish Centre for Environment and Energy (DCE) and Aarhus University have established data agreements (MOUs) with the institutes and organizations to ensure that the required data is available to prepare the emission inventory on time. Data is shared with DCE and Aarhus University, and updated in the Integrated Database Model on an annual basis. Close cooperation between research and advisory services (SEGES) allows research to work with actual and high quality data, while advisory services have actual core data to its disposal enabling high quality advisory services and the provision of benchmarks to their farmers.

Table 4: Institutes involved in Denmark’s agriculture emission inventory

InstituteKey data/information collected
Statistics Denmark Agricultural Statistics• Livestock production
• Milk yields
• Slaughtering data
• Export of live animals poultry
• Land use
• Crop production
• Crop yields
Danish Centre for Food and Agriculture (DCA), Aarhus University• N-Excretion
• Feeding plans
• Animal growth
• Use of straw for bedding
• N-content in crops
• Modelling of data regarding N-leaching/runoff
• NH3 emission factor
SEGES• Housing type (until 2004)
• Grazing situation
• Manure application time and methods
• Estimation of extent of field burning of agricultural residues
• Acidification of slurry

Source: adapted from Denmark’s NIR 2017

Factors contributing to development of the approach over time

Data availability has played a key role in the development of Denmark’s approach. Due to the European Nitrates Directive coming into force in 1991, a nation-wide monitoring program was established in Denmark. All aspects of the aquatic environment, including key drivers of nitrogen leaching, such as the agriculture sector, were included in the monitoring program.

In 1996, SEGES and Aarhus University realized that the nation-wide monitoring program resulted in a great source of detailed information on agriculture practices, including feeding practices and manure management. Since 1996 this data has thus been integrated in the national GHG inventory, which enabled the shift from a Tier 1 to Tier 2 approach.

The availability of the database of feeding plans has likewise facilitated the development of country-specific methane conversion factors. This database exists due to the strong farmer advisory system in the country. Denmark’s first agricultural advisory was as early as 1874. Farmers participating in the annual monitoring are mainly interested in the performance benchmarks the monitoring system produces. At the same time, the resulting data provide actual and up to date input data for use in the national inventory.


(1)  From 1990 to 2015, emissions decreased from 12.6 million tonnes CO2 equivalents to 10.3 million tonnes CO2 equivalents (~18% reduction). The total N2O emission from 1990-2015 decreased by 28% and can largely be attributed to the decrease in N2O emissions from agricultural soils. A 9% reduction in methane emissions from enteric fermentation over the last years can mainly be explained by a reduction in cattle number.


Further Resources

Helping ALF, et al. 2014: Note: Calculation of Ym for dairy cows in Denmark. Department of Animal Sceince, Aarhus University, AU Foulum, P.O. Box 50, DK-8830 Tjele, Denmark.

Olesen JE, et al. 2005. Evaluering af mulige tiltag til reduction af landbrugets metanemissioner. Arbejdsrapport fra Miljøstyrelsen Nr. 11 /2005. Chapter 1 (Allan Danfær): Methane emission from dairy cows.

Pulse HD. 2016. Normative figures 2000-2015. DCA Danish Centre for Food and Agriculture, Aarhus University.

Poulsen HD, et al. 2001. Kvælstof, fosfor og kalium i husdyrgødning normtal 2000. DJF rapport nr. 36 husdyrbrug, Danmarks Jordbrugsforskning. (In Danish).


Author: Andreas Wilkes, Values for development Ltd (2019)
Livestock country inventory: Colombia

Overview of Colombia’s current Tier 2 approach (1)

Agriculture, forestry, and other land use (AFOLU) accounts for about 46% of Colombia’s net GHG emissions in 2012 (IDEAM et al. 2017). Gross emissions from the AFOLU sector have been falling in recent years, while total removals have increased. Natural forests cover more than half of the country’s land area, and cultivated pastures and natural grasslands about one-quarter of the total land area. Pasture and grassland are mainly used for extensive cattle grazing. Historically, expansion of pasture has been the main driver of deforestation. Colombia’s NDC commits to reduce total national GHG emissions by 20% compared to a business-as-usual scenario, or 30% with international support. Sustainable cattle farming, including silvopastoral systems, are key measures being developed in Colombia to deliver on this target. A Sustainable Bovine Livestock NAMA has been proposed to increase efficiency in cattle production systems and conserve or restore natural ecosystems.

Enteric fermentation, in particular is a major source in the AFOLU inventory, accounting for 13% of gross emissions in 2012, 92% of which derives from cattle (IDEAM et al. 2017). Grazing animals also contribute almost 73% of direct N2O emissions from management of soils. Colombia estimates enteric fermentation from cattle using a Tier 2 approach and a Tier 1 approach for other livestock emission sources. A Tier 2 approach for cattle enteric fermentation emissions was first adopted in Colombia’s Second National Communication submitted in 2010 (IDEAM, 2010). The approach has been revised over time. Colombia’s Tier 2 approach began by using the IPCC model. In the latest inventory (IDEAM et al. 2017), activity data derived from expert judgement from various industry sources and emission factors were estimated using the RUMINANT model (Herrero et al. 2013).

How Colombia’s approach to estimating enteric fermentation emissions has evolved over time

Initial Tier 2 approach: In its 2010 national communication (IDEAM 2010), Colombia reports the results of applying a Tier 2 approach to 4 types of cattle (i.e., dairy and non-dairy cows, and non-dairy mature males and steers) in 24 of the country’s sub-national departments (Table 1). Livestock population data was provided by the Ministry of Agriculture and Rural Development (MARD) and industry associations and was then processed to estimate populations by climate zone for estimation of manure management emissions. The characterization of cattle was based on official national statistics, local research, and interviews with industry experts, including researchers, funding bodies, and associations of producers at the regional level (Nieves and Olarte 2009).

Table 1: Evolution of livestock characterization

Sub-categoriesRegions
NC 2 (2010)Dairy: mature female
Non-dairy: mature female, mature male
24 departments
BUR 1 (2015)Dairy: High production cows, low production cows
Non-dairy:
Cows for meat production
Bulls used for reproductive purposes
Pre-growing calves
Replacement calves
Fattening cattle
1 national value
NC 3 (2017)Dairy: High production cows, low production cows
Non-dairy:
Cows for meat production
Bulls used for reproductive purposes
Pre-growing calves
Replacement calves
Fattening cattle
10 regions

BUR1 Tier 2 inventory: In the inventory reported in Colombia’s First Biennial Update Report (IDEAM et al. 2015), seven sub-categories of cattle are reported, with one emission factor, applied in the country for each cattle category. Activity data for estimation of gross energy intake derived from various sources for different sub-categories, depending on data availability (Table 2).

Table 2: Activity data sources used in BUR 1 Tier 2 approach (IDEAM et al. 2015)

ParameterData sources
Live weightDatabases and published reports of FEDEGAN (Colombian Federation of Cattle Ranchers);
Expert judgement by staff and consultants from FEDEGAN, UNDP, IDEAM and FAO
Analysis of National Administrative Department of Statistics (DANE) livestock slaughter survey (ESAG) data
Weight gainPublications of FEDEGAN
Expert judgement by staff and consultants from FEDEGAN, UNDP, IDEAM and FAO
Milk yieldPublications of FEDEGAN
Expert judgement based on data from the FEDEGAN modal farm database
Feed digestibilityExpert judgement by staff and consultants of FEDEGAN, UNDP, IDEAM and FAO

Source: IDEAM et al. (2015)

Third National Communication: The Third National Communication (IDEAM et al. 2017) introduced a further refinement of the Tier 2 approach. Building on an ongoing program of research conducted by the International Center for Tropical Agriculture (CIAT), the most recent approach uses the RUMINANT model to estimate emission factors for different types of cattle in 10 regions in the country.

The RUMINANT model: The RUMINANT model was developed to predict feed intake, livestock productivity, and methane emissions in tropical conditions on the basis of animal and feed characteristics (Herrero et al. 2013). The model estimates intake based on animal characteristics and nutrient supply. Based on the chemical composition of feed, the model simulates the degradation and passage of feed. From this, metabolizable energy and protein supply to the animal is estimated, as well as other outputs, including methane production. RUMINANT simulates on a daily time step.

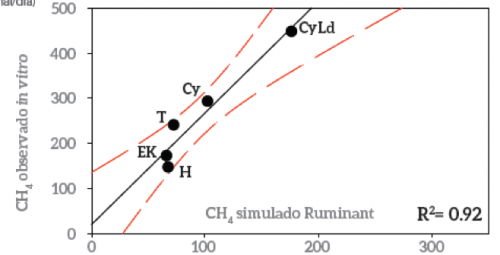
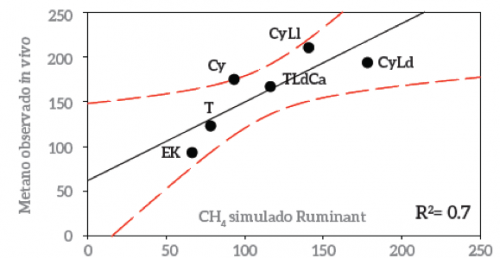
Validation of the RUMINANT model: With the financial support from USAID in the frame of the LivestockPlus project of CCAFS, CIAT is undertaking ongoing research to validate the capacity of the RUMINANT model to simulate enteric CH4 emissions under Colombian conditions. Prior to preparation of the Third National Communication, a short study was conducted using cattle fed on seven forage-based diets combinations, including 3 single forage diets and 4 mixed forage diets. Methane emission was estimated through both in vitro and in vivo (polytunnel) methods (Lockyer & Jarvis, 1995; Theodorou et al. 1994). The data on livestock and feed characteristics were used to run the RUMINANT model, and researchers then compared the CH4 emissions estimated with observed and simulated data (Ruden-Restrepo et al. 2017; Serena et al. 2017). The results showed that the RUMINANT model provided an accurate estimate of methane emissions, with a correlation coefficient (R2) between observed in vivo measurements and simulated data of 0.7 (Figure A). Correlations were particularly high for some of the mixed diets tested. Compared with the in vitro measurement data, the model had an even higher correlation (R2 = 0.92) (Figure B).

Figure A: Relationship between observed in vivo methane measurement values and simulated values (L CH4/animal/day)

Source: Ruden-Restrepo et al. 2017

Figure B: Relationship between observed in vitro methane measurement values and simulated values (L CH4/animal/day)

Application of the RUMINANT model in the national inventory: CIAT provided training to the national inventory compilation agency on the use of the RUMINANT model software. The model was parameterized using data on regional characteristics of each type of animal were collected by the Agricultural Synergies project, a Norwegian funded research project implemented by FEDEGAN, CIAT, and University of Princeton. The data were collected through 5 workshops conducted with academics, livestock producers, and agronomists in different regions of the country during which information on typical production systems were recorded. Data for seven different animal types in 10 regions and typical feed characteristics was input into the RUMINANT model. The model estimated daily methane emissions per animal. The inventory then applies this emission factor to the population data in each animal category and number of days alive.

The validated models can also be applied to ex ante assessment of livestock mitigation options in the Sustainable Bovine Livestock NAMA.


(1) This country case study was produced with valuable inputs from Felipe Torres (Universidad Nacional de Colombia) and Jacobo Arango (CIAT).


Further Resources

Herrero M, et al. 2013. Biomass use, production, feed efficiencies, and greenhouse gas emissions from global livestock systems. Proceedings of the National Academy of Sciences of the United States of America.

IDEAM. 2010. Segunda Comunicación Nacional ante la Convención Marco de las Naciones Unidas sobre Cambio Climático. Bogotá D.C., Colombia.

IDEAM, PNUD, MADS, DNP, CANCILLERÍA. 2015. Primer Informe Bienal de Actualización de Colombia. Bogotá D.C., Colombia.

IDEAM, PNUD, MADS, DNP, CANCILLERÍA. 2017. Tercera Comunicación Nacional De Colombia a La Convención Marco De Las Naciones Unidas Sobre Cambio Climático (CMNUCC). Tercera Comunicación Nacional de Cambio Climático. IDEAM, PNUD, MADS, DNP, CANCILLERÍA, FMAM. Bogotá D.C., Colombia.

Lockyer DR, Jarvis SC. 1995. The measurement of methane losses from grazing animals. Environmental Pollution, 90(3): 383-390.

Nieves HE, Olarte CP. 2009. Módulo de agricultura. Inventario Nacional de Fuentes y Sumideros de Gases de Efecto Invernadero 2000-2004. IDEAM, Bogotá, Colombia.

Republic of Colombia (n.d.). Sustainable Bovine Livestock.

Ruden-Restrepo, A. et al. 2017. Validación del modelo Ruminant a través de mediciones de campo y laboratorio para obtener estimaciones precisas de emisiones de metano entérico bajo condiciones tropicales como soporte a las NDC Colombianas. Poster presented at 3a. Conferencia de Gases de Efecto Invernadero en Sistemas Agropecuarios de Latinoamérica (GALA 2017), Colonia, Uruguay.

Serena, L. et al. 2017 Validación del modelo RUMINANT para obtener estimaciones precisas de las emisiones de metano entérico en condiciones tropicales para apoyar las Contribución Prevista Determinada a Nivel Nacional (NDC) Colombianas.

Theodorou MK, et al. 1994. A simple gas production method using a pressure transducer to determine the fermentation kinetics of ruminant feeds. Animal Feed Science and Technology.


Photo by © Edwin Huffman/World Bank

Author: Andreas Wilkes, Values for development Ltd (2019)
Livestock country inventory: Bulgaria

Overview of Bulgaria’s current Tier 2 approach

Methane from enteric fermentation and N2O from animal sources have consistently been identified as key sources in Bulgaria’s GHG inventory. Together, cattle and sheep have accounted for 80-90% of enteric fermentation emissions in each inventory year since the late 1980s. Bulgaria began to use the IPCC Tier 2 approach for cattle in 2010, and for sheep in 2011. Inventories since 2003 have reported using a Tier 2 approach for methane emissions manure management, but no technical description of the approach used is given in the inventory reports.

Table 1: Overview of Tiers used for livestock methane emissions in Bulgaria’s national GHG inventories

Livestock typesTier used for enteric fermentation (CH4)Year adopted*Tier used for manure management (CH4)Year adopted*
Dairy cattleT22010T22003
Non-dairy cattleT22010T22003
SheepT22011T1-
PigsT1-T22003
OtherT1-T1-

*Year refers to the year of NIR submission

Enteric fermentation

Description of approach: Bulgaria implements the IPCC Tier 2 model for both cattle and sheep. The approach estimates daily gross energy (GE) intake on the basis of animal performance, management practices and environmental factors. GE is converted to methane using a methane conversion factor (Ym), and estimated daily emissions are multiplied by number of days to make an estimate of annual emissions per head. Activity data on the population of livestock of each category are multiplied by the EF to estimate total annual emissions from enteric fermentation for that category of livestock.
Implementation of the approach:

Activity data: Livestock population data is provided each year by the Ministry of Agriculture. Emissions are separately estimated for mature dairy cattle and four other types of cattle (Table 2). For the period 1988-2000, livestock population data came from the Yearbooks of the National Statistics Institute. Since 2000, there has been an agreement between the Executive Environment Agency the centralized unit responsible for inventory compilation with the Agrostatistics Department of the Ministry of Agriculture and Food (MAF) to provide activity data for the inventory. MAF collects the agricultural statistics through surveys conducted in accordance with European regulations(1).

Table 2: Livestock categorization in Bulgaria’s Tier 2 approach

Dairy cattleNon-dairy cattleSheep
1 category (mature dairy cattle)4 categories defined by age and sex (mature male, mature female, young male, young female)4 categories defined by:
Age, physiological status (female, male intact, male castrates) and purpose (meat/wool, milk)

Estimation of emission factors: Tables 3 and 4 show the sources of data used when Bulgaria first applied the Tier 2 approach (2010) to dairy and other cattle and in its most recent inventory submission (2017). For dairy cattle, Bulgaria uses country specific data for live weight, calf birth weight, annual milk yield and fat content of milk.

Since NIR 2017, a country specific value for feed digestibility from a published paper has been used for dairy cattle. All other parameters use IPCC default values. For non-dairy cattle, Bulgaria uses country specific data for live weight and mature weight, and IPCC default values for all other parameters. For sheep, national data on live weight and weight at weaning, milk yield and fat content of milk are used. All other parameters use IPCC default values.

With the exception of digestibility for dairy cattle, country specific values are updated annually. Estimated GE and EFs thus vary year to year. For mature dairy and non-dairy cattle, live weight estimates remain constant over the time series. For young growing cattle and sheep, live weight estimates vary year to year. The live weight estimates reported by the Ministry of Agriculture are not published data but are reportedly based on measurements. No detail is given in NIRs on how the measurements are conducted. The main drivers of change in emission factors have been an increase in milk yields, change in live weight of young cattle and a decline in the dairy cattle herd, causing a change in the population structure of animals in the ‘non-dairy cow’ category.

Table 3: Data sources used for Tier 2 estimate of enteric fermentation emissions from mature dairy cattle

Model parameterData source in 2010Data source in 2017
Average live weightMinistry of AgricultureLivestock Breeding Agency
Calf birth weight (kg)Eq. 7 IPCC 1996 Ref ManualMinistry of Agriculture
Coefficient for maintenance (Cfi)IPCC defaultIPCC default
% of time spent on pasture
Coeff. for feeding situation (Ca)IPCC defaultIPCC default
Annual milk yield (kg)Ministry of AgricultureMinistry of Agriculture
Average fat content (% fat)Ministry of AgricultureMinistry of Agriculture
% pregnant in the year
Coefficient for pregnancy (Cpreg)IPCC defaultIPCC default
DigestibilityTable 10.2 IPCC 2006 Ref ManualScientific publication
Gross energy (GE)CalculatedCalculated
Methane conversion factor (Ym)Table 4.8 GPG 2000IPCC 2006 GL
Emission factorCalculatedCalculated

Table 4: Data sources used for Tier 2 estimate of enteric fermentation emissions from non-dairy cattle

Model parameterData source in 2010Data source in 2017
Average weightMinistry of AgricultureLivestock Breeding Agency
Calf birth weight (kg)Eq. 7 IPCC 1996 Ref ManualMinistry of Agriculture
Daily weight gain (kg/day)IPCC default‘Default’
Coefficient for maintenance (Cfi)IPCC defaultIPCC default
% of time spent on pasture
Coeff. for feeding situation (Ca)IPCC defaultIPCC default
Annual milk yield (kg)Ministry of Agriculture
Average fat content (% fat)Ministry of Agriculture
% pregnant in the year
Coefficient for pregnancy (Cpreg)IPCC defaultIPCC default
DigestibilityTable 10.2 IPCC 2006 Ref ManualIPCC default
Gross energy (GE)CalculatedCalculated
Methane conversion factor (Ym)Table 4.8 GPG 2000
Emission factorCalculatedCalculated

The country specific data on milk production and live weight come from surveys conducted by the Agrostatistics Department of MAF. Data on the fat content of milk is obtained from EUROSTAT. Data on live weight is provided by the Agrostatistics Department of MAF. For mature cattle, the data are informed by measurements, but are not formally published data and NIR 2017 notes that the data can be considered ‘expert judgement’. These weights are constant over time. For calves and heifers, the data are based on measurements, which change from year to year.

Inventory improvements: Bulgaria’s initial application of the Tier 2 model used a mix of country-specific and default data. Over time, the default values used have changed, and the number of parameters using country specific data has increased (Table 5).

Table 5: Cattle enteric fermentation emission inventory improvements in Bulgaria (2011-2017)

ImprovementYear*
Activity data-
Livestock characterization-
Emission factorsUsed revised country specific values for milk fat content2017
Revision of live weight estimation method for young cattle2014
Adoption of IPCC 2006 GL Ym default value2015
Used country specific value for feed digestibility for dairy cattle2017
Uncertainty estimationUNCAD recalculated by Ministry of Agriculture2017

*Year refers to the year of NIR submission

Revision of live weight data: Until NIR 2014, the inventory used the slaughter body weight of young cattle, but this led to overestimation of the IEF for young cattle. Following an EU Effort Sharing Decision (ESD) review, Bulgaria changed to using average live weight rather than slaughter weight, and recalculated previous inventory estimates.

Revision of country specific value for milk fat content (2017): Before 2017, data for milk fat content was provided by the Agrostatistics Department at MAF. In 2017, an official time series from 2006 onwards became available from EUROSTAT, and the emissions time series for dairy cattle was recalculated in 2017 using the new dataset.

Adoption of IPCC 2006 GL Ym value: Prior to NIR 2015, the IPCC GPG 2000 Ym values were used. In 2015, the IPCC 2006 GL values were adopted.

Used country specific value for digestibility for dairy cattle (2017): In NIR 2017, a new country-specific value for %DE was used for dairy cattle. This value derived from a scientific publication that used acid insoluble ash as a marker in fresh herbage and feces to determine digestibility (2).

Revised UNCAD estimate (2017): For the uncertainty of emission factors, Bulgaria’s inventory uses a default uncertainty estimates from IPCC 2006 GL. For activity data, until 2017, the country-specific estimate of activity data uncertainty was 2%, but in 2017 a new estimate of 0.64% was provided by MAF based on examination of whether the livestock population survey precision requirements in EU regulations had been met.

Manure management (Methane)

Approach used: IPCC approach (T2 for cattle and swine), T1 for other livestock.

Implementation of the approach:

  • Activity data are taken from national statistics.
  • VS excretion rates for the different types of cattle are based on the digestibility and other input values used to estimate GE for enteric fermentation (see above). IPCC default values are used for other parameters required for estimation of VS. For pigs, country-specific VS estimates are based on a scientific publication, which in turn relied on a combination of published and unpublished literature (Penkov et al. 2014).
  • Values for Bo and MCF use IPCC default values.
  • The fraction of manure handled in different management systems is based on a survey conducted every 5 years by the Agrostatistics Department at MAF. This survey documents the number of animals per species and category; the quantity fresh manure and nitrogen per animal category; and the nitrogen emitted into different parts of the ecosystem. The data collection methodology is based on the methodologies used by EUROSTAT. The distribution of manure management systems in the intervening years is estimated by extrapolation. This requires recalculation of emission estimates for the years prior to a year with new survey data.

Inventory improvements:

ImprovementYear*
Activity dataRecategorization of pig manure AWMS2017
Manure management systemsRevision of MCF for anaerobic lagoons2015
Emission factorsRe-estimation of young cattle weights based on ESD review2014
Uncertainty estimationUNCAD recalculated by Ministry of Agriculture2017

*Year refers to the year of NIR submission

Bulgaria has made a number of recalculations of manure management emissions in recent years. Among the few that are transparently documented are:

Revision of MCF value for anaerobic lagoons (2015): Prior to 2015, an MCF of 90% was used for anaerobic lagoons. In NIR 2015 this was revised to 70% on the basis of recommendations from expert review.

Recategorization of pig manure AWMS from anaerobic lagoons to liquid storage systems (2017): Prior to 2017, about 90% of pig manure was assigned to anaerobic lagoons. Review of the 2006 IPCC GL definition of anaerobic lagoons at the request of the expert review found that environmental and management factors in Bulgaria are not consistent with this definition. These AWMS were recategorized as liquid storage systems, which have a lower MCF (20%).

Uncertainty management

Prior to NIR 2017, UNCAD was estimated at 2% for all livestock types. In NIR, a new estimate of UNCAD was used. The new UNCAD estimate is based on the official statistical data in the country. It is country specific and based on the Regulation (EC) No 1165/2008 of the European Parliament and of the Council concerning livestock and meat statistics and repealing Council Directives 93/23/EEC, 93/24/EEC and 93/25/EEC. The estimate was made using statistical samples representative of level 6 statistical areas (NUTS2). As a result, UNCAD has been revised in NIR 2017 to 0.64% for cattle, 0.51% for swine and 1.63% for sheep. Total uncertainty for livestock sources has decreased. UNCEF estimates use IPCC defaults.


(1) Regulation (EC) No 1165/2008 of the European Parliament.

(2) Todorov & Ali, 2009


Further Resources

Penkov D, et al. 2014. Methods for Determining the Release of Greenhouse Gas Emissions from Pig and Poultry Production in the Republic of Bulgaria. Global Journal of Science Frontier Research: Department of Agriculture and Veterinary, 14(5).


Author: Andreas Wilkes, Values for development Ltd (2019)
Livestock country inventory: Austria

Overview of Austria’s current Tier 2 approach

Livestock typesTier used for enteric fermentation (CH4)Year adopted*Tier used for manure management (CH4)Year adopted*
Dairy cattleT22003T22003
Non-dairy cattleT22003T22003
SheepT1-T1-
Pigs--T22003
OtherT1-T1-

*Year refers to the year of NIR submission

Livestock categorization method:

Dairy CattleNon-dairy CattleSwine
1 Category8 categories defined by:
Age, physiological status, production system (organic non-organic)
3 categories: young & fattening pigs >20 kg; breeding sows > 50 kg; piglets <20 kg.

Enteric fermentation

Approach used: Intake-based estimate of gross energy

Why was this approach adopted? Before 2003, livestock emissions were estimated using the CORINAIR system for GHG inventories. Because this model is not consistent with IPCC GPG requirement to use a higher Tier approach for key sources, Austria developed a Tier 2 approach in NIR 2003. Available research on nitrogen-flows in livestock systems was used for key sources (i.e. cattle).

Description of approach: Austria’s initial Tier 2 approach was based on research on nitrogen flows in livestock production systems that had been conducted as part of Austria’s compliance with the European Commission’s Nitrates Directive, which limits nitrogen application rates on agricultural land. An EC methodology was applied to estimate the N content of manure based on dietary N intake, N content of livestock products, and gaseous N losses. DMI was estimated on the basis of prior research that used 20-year feeding experiment data to predict feed intake on the basis of nutritional (forage quality and composition, concentrate level) and animal factors (milk yield, live weight, stage of lactation, breed). In the initial version of the N-flow model, crude protein was the main nutritional content of the ration considered. Crude protein content in different diets required to achieve different levels of milk yield enabled estimation of DMI of those diets, and DMI is then converted to GE. The national GHG inventory uses data from statistics agencies on milk yield and live weight to estimate GE. GE is then converted to methane emissions using the IPCC equation (EF=GE*Ym/55.65).

Implementation of the approach: For dairy cattle, GE is estimated from annual statistical data on milk yield. The EF thus changes with fluctuation between years in average milk yield, which is assumed to reflect the change in the underlying diet.

Table A: Relationship between energy intake and milk yield for dairy cattle in Austria

Milk yield3500400045005000
GE (MJ GE day-1)214.96227.63240.22252.75

Source: Austria NIR 2017

For non-dairy cattle, diet varies depending on whether they are in organic or non-organic production systems. Typical diets in organic and non-organic systems were characterized for different classes of non-dairy cattle. Expert opinion suggests that typical diets did not change over time, thus GE per animal remains constant in the time series. However, the proportion of cattle in organic and non-organic systems does change. Annual activity data on numbers of cattle of different classes in each production system are used. Thus, the implied emission factor changes year to year, depending on the structure of the cattle population in different production systems.

Table B: Typical diets and gross energy of non-dairy cattle in conventional and organic production systems in Austria

ConventionalSuckling cowsCattle <1 yearCattle 1-2 yearsCattle >2 years
Live weight600 kg210 kg530 kg600 kg
Diet50% green feed
20% hay
30% grass silage
15% green feed
20% hay
30% grass silage
35% maize silage
20% green feed
15% hay
30% grass silage
35% maize silage
40% green feed
20% hay
30% grass silage
10% maize silage
GEI (MJ GE day-1)191.5684.36166.96163.44
OrganicSuckling cowsCattle <1 yearCattle 1-2 yearsCattle >2 years
Live weight600 kg190 kg480 kg580 kg
Diet50% green feed
20% hay
30% grass silage
355% green feed
20% hay
45% grass silage
40% green feed
15% hay
45% grass silage
40% green feed
15% hay
45% grass silage
GEI (MJ GE day-1)191.5672.06151.14159.93

Source: Austria NIR 2017

Inventory improvements:

ImprovementYear*
Activity data-
Livestock characterization-
Emission factorsRe-estimation of milk yield GE relationship2007
Revision of GE estimates for non-dairy cattle2010
Adoption of IPCC 2006 GL Ym default value2015
Uncertainty estimationReplaced UNCAD literature value with value based on review of statistical data2016

*Year refers to the year of NIR submission

Re-estimation of milk yield GE relationship (2007): 2005 and 2006 inventory reviews suggested improving the relationship between GE and milk yield. The main improvement in the inventory method was a re-estimation of the milk yield-GE relationship for dairy cattle. This was based on research publication (Gruber & Putsch, 2006) and included in the 2007 NIR. The research reviewed actual feed rations based on expert opinion from farm advisors, and forage quality based on field studies in representative grassland and dairy farm areas. The re-estimation led to higher EFs because the revised model considered more indicators of forage composition and quality than the original model, which considered protein only.

Revision of GE estimates for non-dairy cattle: In NIR 2010, new studies on suckler calf growth suggested higher growth than previously assumed and thus higher milk yields to support calf growth. This resulted in changes in the estimated GE per animal in non-dairy cattle systems.

Adoption of IPCC 2006 GL Ym value: Prior to NIR 2015, the IPCC 1996 Ym value of 0.60 was used. In 2014, work focused on revising the agricultural model according to the IPCC 2006 GL, which was reviewed by external Austrian agricultural experts.

Manure management (Methane)

Approach used: IPCC approach (T2 for cattle and swine), T1 for other livestock.

Description of approach: The Austrian Tier 2 approach uses the IPCC Tier 2 model for manure management.

Implementation of the approach:

  • Activity data are taken from national statistics.
  • N excretion rates for the different types of cattle are derived from the model used to estimate GE for enteric fermentation (see above). For non-dairy cattle, VS excretion rates are converted using country specific research on GE intake, digestibility and ash content. For swine, there is no data on performance, and VS excretion rates of swine were kept constant for the whole time series.
  • Values for Bo and MCF initially used IPCC default values, but these were later updated using national research.
  • The fraction of manure handled in different management systems initially used data from an academic study. These were later updated using a new study, and a combination of extrapolation and expert opinion were used to recalculate the time series for each type of MS.

Inventory improvements:

ImprovementYear*
Activity data-
Manure management systemsNew data on distribution of manure in different management systems2010
Including biogas in management systems2013
Emission factorsRe-estimation of milk yield N excretion relationship2007
Country-specific values for MCF2010
Estimation and re-estimation of biogas MCF2013
Uncertainty estimationReplaced UNCAD literature value with value based on review of statistical data2016

*Year refers to the year of NIR submission 

Re-estimation of N excretion rates: The research used to re-estimate GE values for enteric fermentation in NIR 2007 (Gruber & Putsch, 2006) was also used to re-estimate N and VS excretion values for different types of cattle. A time series for VS was generated based on the times series for milk yield and the distribution of livestock between production systems.

Improvements in manure management system (MMS) data: Austria’s initial inventories noted the lack of national statistics on MMS. NIRs 2003-2009 used data from an academic publication reporting a survey conducted in 1989-1992. Due to lack of alternative data, this data was applied to the whole reporting period 1990-2001. Inventory review reports in 2006 and 2008 noted that the distribution of housing and storage systems has undergone major changes. In 2008, the inventory agency commissioned a review of the estimation method, and a nationally representative survey of MMS conducted in 2005 by a national research project was identified (Amon et al. 2007). To use the survey data on MMS in the NIR 2010, a plausible time series using the earlier survey and new survey data was created using expert opinion for years prior to 2005, and using linear extrapolation for years after 2005. The survey also provided improved information on the timing of storage, which could be used together with measurements of emission factors (see below) to improve emission estimates.

Country-specific values for MCF for liquid systems: The agriculture and education ministries had funded a 3-year measurement campaign on emissions from manure stores. Results were published in peer reviewed publications (1), and were used for MCF values for liquid manure systems in NIR 2010.

Adding biogas storage to the MMS and MCF data: Inventory review in 2013 recommended to include consideration of biogas as a management method. This was done in NIR 2015 using data from different sources for different years. Initially, methane losses were not considered. A centralized expert review recommended to consider this, and the MCF for biogas storage was revised in NIR 2016.

Uncertainty management

Uncertainty of activity data: Prior to NIR 2016, UNCAD was estimated on the basis of a literature value. In 2016, livestock statistics were reviewed. Uncertainties were derived by analysing official Austrian livestock numbers published in June and December each year. Comparing these two data sets the standard deviation was calculated. As a conservative approach, the doubled standard deviation was taken, leading to uncertainties for dairy cattle of 2%, for non-dairy cattle of 1%, and for swine of 4%.

Uncertainty of emission factors: In the 2003 inventory, uncertainties for enteric fermentation were estimated using Monte Carlo simulation. Assuming a normal probability distribution, the calculated standard deviation is 4%. This indicates there is a 95 % probability that CH4 emissions are between +/- 2 standard deviations, i.e. between 153 Gg and 178 Gg in the year 1990 and between 138 Gg and 162 Gg in the year 2001.

The Monte Carlo uncertainty method used has the advantage, compared to the default propagation method, that it produces better results if the uncertainty is in a higher range (Winiwarter & Orthofer, 2000). Uncertainties that were taken into account for calculations of the total uncertainty include:

  • Gross Energy Intake (GE): +/- 20% (estimated by expert judgement of Dr. Amon)
  • Methane Conversion Factor (Ym) cattle: +/- 8.3% (IPCC Guidelines, 1997)
  • Livestock: (Source: Statistic Austria; sample survey –) statistical accuracy 95%
  • Share of organic farming: +/- 10% (estimated by expert judgement)
  • EF for Sheep, Swine, Horses, Goats (IPCC default values): +/- 30% (IPCC Guidelines, 1997)
  • The emission factors for the “Tier 2” method are determined by the uncertainty of the gross energy intake (GE) and the CH4 conversion rates (Ym). The uncertainty was estimated to be about +/- 20% (Amon et al. 2002).

(1)  AMON et al. 2002, 2006, 2007


Resources

Amon B, Hörtenhuber S. 2010. Revision of Austria’s National Greenhouse Gas Inventory, Sector Agriculture. Final Report. Division of Agricultural Engineering (DAE) of the Department for Sustainable Agricultural Systems of the University of Natural Resources and Applied Life Sciences (BOKU), study on behalf of Umweltbundesamt GmbH. Wien. (unpublished)

Amon B, et al. 2002. Emission Inventory for the Agricultural Sector in Austria – Manure Management, Institute of Agricultural, Environmental and Energy Engineering (BOKU – University of Agriculture, Vienna), July 2002.

Amon B, et al. 2006. Influence of different levels of covering on greenhouse gas and ammonia emissions from slurry stores. International Congress Series (ICS) No 1293 “2nd International Conference on Greenhouse Gases and Animal Agriculture.”

Amon B, et al. 2007. Tierhaltung und Wirtschaftsdüngermanagement in Österreich. Studie im Auftrag des Bundesministeriums für Landund Forstwirtschaft, Umwelt- und Wasserwirtschaft, Wien.

Gruber L, Putsch E. 2006. Calculation of nitrogen excretion of dairy cows in Austria. Die Bodenkultur, Vol. 57, Heft 1–4, Vienna.


Author: Andreas Wilkes, Values for development Ltd (2019)