Recent advances in measurement and dietary mitigation of enteric methane emissions in ruminants

The aim of this review is to discuss different CH4 measuring and mitigation technologies, which have been recently developed. Some of the technologies include: respiration chamber technique, SF6 method, short-term CH4 measurement techniques (Greenfeed and methane hood systems), sniffer, short-term breath analysis techniques, and several indirect measuring techniques. This review presents recent developments and critical analysis on different measurements and dietary mitigation of CH4 technologies.


Patra A

2016

Journal: Frontiers in Veterinary Science

Grassland management impacts on soil carbon stocks: a new synthesis

The aim of this paper is to provide a new synthesis focused on grassland ecosystems and soil carbon stock sensitivity to management and land use changes: grazing, species composition, and mineral nutrient availability. The synthesis confirms earlier conclusions that improved grazing management, fertilization, sowing legumes and improved grass species, irrigation, and conversion from cultivation all tend to lead to increased soil carbon.


Conant R, Cerri C, Osborne B, Paustian K

2017

Ecological Applications

Manure helps feed the world: Integrated manure management demonstrates manure is a valuable resource

This document provides an introduction to integrated manure management. Additionally, it discusses the benefits challenges to adoption, geographical limitations, costs and funding, and interactions of integrated manure management with other CSA practices. Three case studies are discussed to take a closer look at various management strategies, including manure applications to pastures, integrated livestock systems, and active composting.


Teenstra E, Andeweg K, Vellinga T

2016

Copenhagen, Denmark: CGIAR Research Program on Climate Change, Agriculture and Food Security (CCAFS)

Inventory practice: UK’s GHG R&D Platform supports inventory improvements

Keywords: Institutional arrangements

In recent years, the UK’s Department for Environment, Food and Rural Affairs has supported an inter-related set of research projects aimed at delivering an improved Tier 2/Tier 3 inventory for agriculture. Specific projects are summarized in the table below. Together, these research projects funded:

  • Reviews of existing research;
  • Collection and analysis of new data;
  • Disaggregation of the UK Agricultural Survey and farm practice data according to a typology of representative farm systems so as to be able to apply higher resolution EFs;
  • Improved inventory methodologies; and
  • The implementation of new data and methodologies in the national inventory.
Project codeProject titleSummary of contents
AC0115GHG R&D Platform Methane emission factorsAim: to develop new EFs by exploiting existing datasets held by partner organisations on measurements of ruminant methane emissions; new EFs will then be aligned with spatial and temporal disaggregation of UK farming systems to improve the precision of GHG inventory reporting.
AC0116GHG R&D Platform Nitrous oxide emission factorsAim: to develop new EFs from direct measurements of N2O in order to better reflect management systems within the UK, taking account of the range of soil types and climate, and to reflect potential mitigation methods
AC0114GHG R&D Platform Data managementAim: to provide fundamental improvements in the accuracy and resolution of the UK National Inventory and the development of a more detailed reporting methodology though an intensive period of coordinated exploration, synthesis and modelling of existing data from across the scientific community and industry data holders
SCF0102Delivering the agricultural GHG and ammonia inventoriesAim: to deliver annual inventories of ammonia and GHGs to Defra on a timely basis and annual updates of projected emissions. The project will compile the GHG inventory using the UKs current Tier 1 approach whilst developing an operational Tier 2/3 inventory in accordance with the guidance and evolving outcomes of the GHG R&D Platform.

Author: Andreas Wilkes, Values for development Ltd (2019)

Livestock inventory practice: Analysis of uncertainty in Canada’s livestock inventory

Keywords: Uncertainty analysis | Monte Carlo analysis | sensitivity analysis

What data needs were addressed? To understand the contribution of key factors to inventory uncertainty and provide an improved estimate of overall uncertainty of the livestock inventory.

Why was the data needed? Until 2013, uncertainty of livestock emission sources in Canada’s inventory was estimated using default estimates of uncertainty from the IPCC. An improved estimate of uncertainty was needed for the inventory based on the actual data used in the inventory.

Methods used: Monte Carlo analysis, sensitivity analysis.

How was the data need addressed? A study published in 2012 (Karimi-Zindashty et al. 2012) applied Monte Carlo methods to methane emissions from the Canadian inventory, estimating uncertainty of 38% for enteric fermentation and 73% for methane emissions from manure management. That study identified the methane conversion rate (Ym), the coefficient for calculating net energy for maintenance (Cfi) and the methane conversion factor (MCF) which all used the IPCC default values as the greatest sources of uncertainty. It also highlighted that assigning uncertainty values to regional (provincial) parameters would reduce the uncertainty significantly.

For the national inventory, methods based on those used in the 2012 study were applied, but using the actual parameter values and equations used in the inventory. The inventory uncertainty analysis also assessed the uncertainty associated with the duration of different production stages for beef cattle that are defined in the Canadian inventory, and used the provincial distribution of manure management systems with improved estimates of probability distributions. The analysis was run for 1990, 2005, 2010 and 2012, and trend analysis was carried out to establish the uncertainty in the estimate of the differences in emissions from 1990 to 2012.

The results showed that the uncertainty of enteric fermentation emissions was 39%-40% in different years, and mostly due to cattle emissions, since these are the largest emission source. Trend analysis suggests that emissions of methane increased between the 1990 base year and 2012 by 9 to 19%, with a most likely value of 15% (trend uncertainty 10%), mostly due to enteric fermentation. Similar to the findings from Karimi-Zindashty et al. (2012), the inventory analysis of uncertatiny suggests that the IPCC default parameters (i.e., the methane conversion rate (Ym) and the factor associated with the net energy of maintenance (Cfi) contribute most significantly to uncertainty. These parameters are applied at the national scale, so uncertainty might be reduced by developing parameter values at the regional scale for different animal categories.


Further Resources

Karimi-Zindashty Y, et al. 2012. Sources of uncertainty in the IPCC Tier 2 Canadian livestock model. The Journal of Agricultural Science.


Author: Andreas Wilkes, Values for development Ltd (2019)

Inventory practice: Uncertainty analysis to prioritize further research in New Zealand

Keywords: Uncertainty analysis | meta-analysis | statistical analysis

What data needs were addressed? To understand the contribution of key factors to inventory uncertainty and provide an improved estimate of overall uncertainty of the livestock inventory.

Why was the data needed? In 2008, the estimated uncertainty in the national enteric methane (CH4) emission inventory was ±53%, which was far greater than the estimate for other similar countries. Previous uncertainty analysis conducted in the early 2000’s had identified that uncertainty in the quantity of CH4 produced per unit of feed consumed had a significant impact on overall uncertainty estimates. Since the early 2000’s, the number of related measurement studies had greatly increased and a larger pool of data was available to reassess the related uncertainty.

Methods used: meta-analysis of research data, analysis of statistical uncertainty.

How was the data need addressed?

  1. Meta-analysis of experimental measurements using the SF6 method and caliometry showed that the mean methane yields were similar between sheep of different ages (<1 year and >1 year) and between sheep and cattle.
  2. Analysis of the coefficient of variation in methane yield enabled a revised estimate of uncertainty in the overall livestock enteric methane inventory, which was estimated at ±16%.
  3. Analysis of uncertainty in the methane yield measurement data suggested that in order to reduce uncertainty of the methane yield parameter from 3% to 2%, an additional 400 measurements from 5 experiments would be required, but uncertainty of the overall enteric fermentation inventory would only reduce by 1%.
  4. Analysis of data on methane yield and feed intake as a proportion of energy requirements suggested that methane yield may be inversely proportional to the level of feed intake. The study concluded that further research on this topic is required, because if this relationship is established, then the method used in the inventory to estimate methane yield may need revision.

Further Resources

Kelliher FM, et al. 2009. Reducing uncertainty of the enteric methane emissions inventory. A report prepared for the New Zealand Ministry of Agriculture and Forestry, Wellington.


Author: Andreas Wilkes, Values for development Ltd (2019)

Inventory practice: Sensitivity analysis to prioritize improvements in Senegal

Keywords: Sensitivity analysis

What data needs were addressed? To identify the most important parameters through sensitivity analysis of the IPCC Tier 2 model.

Why was the data needed? Having applied the IPCC Tier 2 method to country-specific data, researchers wanted to identify the most important factors driving emissions in order to prioritize future data improvements and research efforts so as to improve livestock GHG emission estimates and reduce the uncertainty of estimates for Senegal.

Methods used: Sensitivity analysis using regression methods.

How was the data need addressed? Senegal is a tropical country in West Africa, with an estimated cattle population of 3.4 million. Extensive livestock systems in Senegal are based on two main breeds of cattle: zebu Gobra (Bos indicus) in the North and taurine Ndama (Bos taurus) in the South. Together, these two breeds account for about 90% of the cattle population. To quantify emissions from these breeds using the IPCC Tier 2 model, a variety of data sources were used to derive input values. Information mainly came from two national livestock research centers (the Centre de Recherches Zootechniques de Dahra, CRZD and the Centre de Recherches Zootechniques de Kolda, CRZK, which are located in the sylvopastoral and agrosylvopastoral zones of Senegal, respectively). Both research centers frequently collect data through surveys and direct measurements on reproductive (e.g. fertility, calving) and productive (e.g. live weight, weight gain, milk yield) performance of cattle. Consequently, research reports, theses, publications and data from partnerships with international research organizations (e.g. FAO, ILRI, ITC) were used, together with documents from the Livestock Ministry of the Senegalese Government and Regional Centres on Agricultural Statistics. When local information was not available, expert judgement (e.g. for proportion of breeds in the cattle herd) or IPCC default values were used. Tables 1 and 2 show the input values used in the Tier 2 models for lactating cows and draft oxen.

Table 1: Assigned values of input parameters in the Tier 2 model for Gobra and Ndama lactating cows

ParameterSymbolUnitUsed value
GobraNdama
Average daily weight gainADGkg/day0.1350.110
CoefficientCdimensionless0.80.8
Activity coefficientCaMJ/day/kg0.360.36
Maintenance coefficientCfiMJ/day/kg0.3860.386
PregnancyCpdimensionless0.100.10
Feed digestibilityDE%5050
Fat content of milkFat%4.74.24
Average life body weightLWkg250200
Milk yieldMilkkg/day0.9220.870
Mature life body weightMWkg200180
Methane conversion rateYm%6.56.5

Table 2: Assigned values of input parameters in the Tier 2 model for Gobra and Ndama draft ox

ParameterSymbolUnitUsed value
GobraNdama
Average daily weight gainADGkg/day0.1350.110
CoefficientCdimensionless1.21.2
Activity coefficientCaMJ/day/kg0.360.36
Maintenance coefficientCfiMJ/day/kg0.370.37
Feed digestibilityDE%5050
Average amount of workHourh/day1.231.23
Average life body weightLWkg300250
Mature life body weightMWkg200180
Methane conversion rateYm%6.56.5

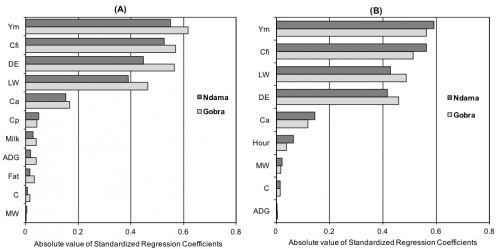
The purpose of conducting sensitivity analysis was to identify which parameters used in the development of methane enteric emission factor require additional research in order to reduce output uncertainty. To do this, the ‘sensitivity’ package (Pujol et al. 2012) implemented in R software (version 3.3.3) was used. First, we defined the possible ranges of values for each parameter and values were generated between the minimum and the maximum of each parameter used in the sensitivity analysis. For all parameters (e.g. milk, liveweight), we assumed a uniform distribution (with a 95% confidence interval) of ± 20% around each used value. These values were input into the IPCC model to produce a range of values for the output (i.e. annual methane enteric emissions per head). Finally, a regression technique was performed to obtain sensitivity indices (i.e., standardized regression coefficient) for each parameter in the model.

The linear regression method shows sensitivity indices for each input parameter used to estimate enteric methane EF (Figure 1). Overall, the results reveal that for lactating cows and draft oxen the methane conversion rate (Ym), the coefficient for calculating net energy for maintenance (Cfi), digestible energy (DE) and liveweight (LW) are the most important parameters affecting the estimated emission factors. Thus, future research should prioritize producing improved estimates of these parameters. While there is relatively more information on live weight and feed digestibility in the Sub-Saharan Africa region, very little research has been conducted on methane conversion rates or other coefficients in the IPCC model. Direct measurements of methane output per unit of feed intake using SF6 tracer techniques or respiration chambers would be necessary to improve estimates of cattle methane emissions in Senegal.

Figure 1: Standardized regression coefficients of input parameters used to calculate enteric methane emission factors for lactating cows (figure A) and draft oxen (figure B) of Gobra and Ndama cattle

Further Resources

Faivre R, et al. 2013. Analyse de sensibilité et exploration de modèles application aux sciences de la nature et de l’environnement. Editions Quae.

Hamby DM. 1994. A review of techniques for parameter sensitivity analysis of environmental models. Environmental monitoring and assessment.

Iooss B. 2011. Revue sur l’analyse de sensibilité globale de modèles numériques. Journal de la Société Française de Statistique.

Makowski D, et al. 2006. Global sensitivity analysis for calculating the contribution of genetic parameters to the variance of crop model prediction. Reliability Engineering & System Safety.

Pujol G, et al. 2012. The R package “sensitivity”, version 1.6-1. CRAN, Technical report.

Saltelli A. 2002. Sensitivity analysis for importance assessment. Risk analysis.


This inventory practice note was contributed by Séga Ndao, El Hadji Traore and Mamadou Diop. For further information, contact ndaosega@gmail.com.


Inventory practice: Verification of Denmark’s inventory inputs and results

Keywords: QA/QC | verification

The Danish GHG inventory is compiled annually by DCE, the Danish Centre for Environment and Energy at Aarhus University (AU), on behalf of the Danish Ministry of Environment. verification activities help establish the reliability of the GHG inventory and may help to point to potential quality improvements in specific sectors/categories. In 2013, an verification was commissioned and conducted by a team of experts from the Department of Environmental Science/DCE, Aarhus University with contribution from external reviewer Ricardo Fernandez, European Environment Agency (EEA). The verification focussed on 25 identified key categories covering energy, agriculture, industry and waste. Using inventory data for 1990 (base year), 2000 and 2010, comparisons of activity data and emission trends were made with data from other sources (e.g. EUROSTAT for agricultural statistics) and with emission factors and trends reported by other countries, such as other EU countries, Australia, Canada, Japan, Russian Federation and the USA.

For livestock data, the following were assessed:

  • Activity data used in the inventory were compared with livestock population data reported by EUROSTAT. For cattle, for example, the deviation between the two sources was less than 4 %,
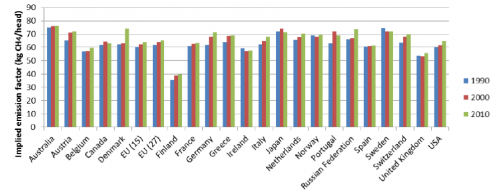
  • Comparison of the implied emission factor not only showed that the IEF was in a similar range to other countries, but that the upward trend in the IEF was also seen in other countries’ submissions (Figure 1).

Figure 1: Comparison of Denmark’s IEF with IEFs reported by other countries

Source: Fauser et al. 2013

A similar analysis was conducted for other livestock types and other livestock-related emission sources, and analysis determined the reasons for any differences with other countries’ inventory results.


Further Resources

Fauser P, et al. 2013. Verification of the Danish 1990, 2000 and 2010 emission inventory data. Aarhus University, DCE Danish Centre for Environment and Energy, 85 pp. Scientific Report from DCE Danish Centre for Environment and Energy No. 79.


Author: Andreas Wilkes, Values for development Ltd (2019)

Inventory practice: Quality assurance (QA) and verification in Australia’s GHG inventory

Keywords: QA/QC

Australia has applied a variety of methods to review and verify the data, methods and results of its livestock inventory. NIR 2017 reports the following activities have been conducted:

Inventory element assessedMethods for QA/QC or verificationSummary findings
Activity data- Australian Bureau of Statistics has QA/QC procedures
- QA/QC procedures applied in inventory compilation
- Inverse modelling of cattle and sheep populations to ensure consistency with reported populations
- External reviews of data


No apparent bias in sheep numbers, possible differences in cattle numbers were incorporated into uncertainty estimates
Implied emission factorsIEFs were compared with IPCC defaults for the regionHigher dairy cattle IEF can be explained by higher milk yield in Australia than in the IPCC default
Feed intake- Comparison of feed intake estimates with IPCC recommended 1-3% of live weight
- Comparison with feed or energy intake values in other countries’ inventories
Methane conversion rates- Comparison with IPCC values
- Reference to scientific reviews
- Conversion rates consistent with IPCC default
- Inventory values within the range reported in the literature and supported by meta-analysis

Author: Andreas Wilkes, Values for development Ltd (2019)

Inventory practice: Quality assurance (QA) and quality control (QC) in The Netherlands

Keywords: QA/QC | institutional arrangements

What data needs were addressed? Documentation of methodologies employed as part of The Netherlands’ inventory.

Why was the data needed? To implement quality control of data, calculations and resulting emissions, and to document updates to methodologies employed in the country’s national inventory.

Methods used: Structured quality assurance and control procedures, documentation in methodology reports.

How was the data need addressed? The Pollutant Release and Transfer Register group, a collaborative group including Statistics Netherlands (CBS), Wageningen University & Research centre (WUR), the National Institute for Public Health and the Environment (RIVM), and PBL Netherlands Environmental Assessment Agency (PBL), is responsible for the collection and establishment of yearly emissions of pollutants to air, water and soil in the Netherlands. The group has a task force leader Agriculture responsible for quality assurance and quality control.

Every year, a check is done on (a) documentation and adoption of data, (b) correct implementation of calculations, (c) consistent use of assumptions and specific parameters and (d) application of complete and consistent datasets. As a result, an action list is developed, listing any actions relevant as a result of the quality control. The list is shared with the secretary of the Emission Registration group.

Furthermore, every year a trend analysis is done, comparing new data with data from the previous year. If emissions exceed 5% at target group or 0.5% at national level, an explanation is sought and again communication to the secretary of the Emission Registration group.

A logbook of all quality control checks, results, explanations and actions is kept at the Emission Registration secretary. Based on the results of the trend analysis, feedback on the control and correction process (‘action list’) the Working Group on Emissions Monitoring (WEM) gives advice to the institute representatives (Deltares on behalf of Rijkswaterstaat, Statistics Netherlands (CBS) and Netherlands Environmental Assessment Agency (PBL) to approve the dataset.

Detailed methodologies employed as well as any updates of methodologies are reported in separate methodology reports.


Further Resources

Vonk J, et al. 2018. Methodology for estimating emissions from agriculture in the Netherlands update 2018. Calculations of CH4, NH3, N2O, NOx, PM10, PM2.5 and CO2 with the National Emission Model for Agriculture (NEMA). Wageningen, The Statutory Research Tasks Unit for Nature and the Environment (WOT Natuur & Milieu). WOt-technical report.

Vonk J, et al. 2016. Methodology for estimating emissions from agriculture in the Netherlands. Calculations of CH4, NH3, N2O, NOx, PM10, PM2.5 and CO2 with the National Emission Model for Agriculture (NEMA). Wageningen, The Statutory Research Tasks Unit for Nature and the Environment (WOT Natuur & Milieu). WOt-technical report.


Author: Andreas Wilkes, Values for development Ltd (2019)