CSA-PF aims to guide stakeholders in optimizing national and sub-national agricultural planning, by providing methods for:
- Identifying promising CSA practices in relation to key production systems
- Evaluating the context-specific outcomes of these practices
- Analyzing the costs and benefits of implementation, as well as barriers to adoption, and
- Identifying strategies that support the implementation of CSA practices on the field
The process generally takes between 4-8 months, but can be simplified. Format is downloadable guidebooks. Currently in pilot phase. Developed by CCAFS.
CCAFS, CGIAR Research program on Climate Change, Agriculture, and Food Security: Wageningen, The Netherlands
The CCAFS-MOT tool integrates published empirical models to emissions for different land use systems according to management types. Allows the user to rank mitigation potential of over 34 crop and livestock management practices, including geographic distinctions. Intended for decision-makers at the national and subnational levels to prioritize low-emission options in the agriculture sector. Excel-based, downloadable tool with minimal data input requirements (5-10 minutes). Developed by CCAFS and University of Aberdeen in collaboration with USAID.
CCAFS, CGIAR Research program on Climate Change, Agriculture, and Food Security: Wageningen, The Netherlands
This Quick Guidance on Greenhouse Gas Accounting for Sustainable Land Management (SLM) provides an overview of SLM activities subject to greenhouse gas appraisal, guidance in the selection of tools, data needs for the application and final use of the greenhouse gas accounting tools. It complements the more comprehensive Carbon Accounting Tools for Sustainable Land Management report, and it is targeted at leading resource managers and project developers to proficiency in the independent use of greenhouse gas accounting tools.*
Anass Toudert, Ademola Braimoh, Martial Bernoux, Maylina St-Louis, Manar Abdelmagied, Louis Bockel, Adriana Ignaciuk, and Yuxuan Zhao
2019
World Bank
*Excerpt from the abstract
This working paper documents the first attempt at implementing a survey and analyzing the survey data to establish a standardized performance baseline using survey data from central Kenya. The report summarizes the requirements of the Smallholder Dairy Methodology, the methods used for sampling, data collection and data analysis, the main results of data analysis and recommendations for future similar initiatives to quantify standardized baselines for dairy GHG mitigation programs. Appendices present data collection tools, summary statistics, and the data used to estimate parameters in Kenya’s Tier 2 dairy GHG inventory. *
Wilkes A, Odhong’ C, van Dijk S, Fraval S, Wassie SE
2019
*Adapted from the abstract of the working paper
National GHG inventories are often compiled using specialist software, such as the IPCC Inventory Software or ALU Software. The ALU Software has functions to implement the Tier 2 equations for livestock emission sources, and activity data can be directly input into the ALU Software. The IPCC Inventory Software currently (Version 2.54) does not have the function to implement the IPCC Tier 2 equations for livestock emissions. Tier 2 livestock emissions must be calculated in another software and the population data and Tier 2 emission factors are then entered into the IPCC Inventory Software.
Tier 2 livestock inventories are therefore often compiled using custom-made spreadsheets. One benefit of using custom-made spreadsheets is that inventory compilers have a clear view of exactly how the calculations are made. However, there are many equations to programme into the spreadsheet, and there is a risk of errors in either the programmed equations or the units. For example, when milk fat content (%) should be entered as a %, it is correct to enter “4”, but not correct to enter “4%”.
To support inventory compilation using custom-made spreadsheets, a Microsoft Excel spreadsheet is available for download above. The spreadsheet contains draft templates for calculation of emissions from the sources shown in the table below. The templates in the spreadsheet should be adjusted to reflect the inventory structure and can be further edited to reflect any country-specific adjustments to how the IPCC equations are implemented. The ALU Software, which can also calculate Tier 2 emissions, can be used as a cross-check for estimates made using custom-made spreadsheets. The spreadsheet is Tool A.2 in the Livestock Activity Data Guidance (L-ADG) published by the GRA and CCAFS.
Emission sources included in the spreadsheet templates
| Category code and name* | Gases | Source for equations implemented |
| 3A1a Enteric fermentation, cattle | CH4 | IPCC (2006) Vol. 4 Ch. 10 |
| 3A1c Enteric fermentation, sheep | CH4 | IPCC (2006) Vol. 4 Ch. 10 |
| 3A2a Manure management, cattle | CH4, N2O | IPCC (2006) Vol. 4 Ch. 10 |
| 3A2c Manure management, sheep | CH4, N2O | IPCC (2006) Vol. 4 Ch. 10 |
| 3C4 Direct N2O emissions from managed soils (urine and dung N deposited on pasture only)** | N2O | IPCC (2006) Vol. 4 Ch. 11 |
| 3C5 Indirect N2O emissions from managed soils (urine and dung N deposited on pasture only)** | N2O | IPCC (2006) Vol. 4 Ch. 11 |
| 3C6 Indirect N2O emissions from manure management | N2O | IPCC (2006) Vol. 4 Ch. 10 |
* Following the categorization in IPCC (2006) Vol. 1 Ch. 8.
**The templates do not include equations for estimating emissions from application of animal manure to managed soils.
This spreadsheet complements the Livestock Activity Data Guidance (L-ADG) published by the GRA and CCAFS. L-ADG provides suggestions on how to identify, collect and assess the activity data used to compile Tier 2 livestock GHG inventories for cattle and sheep. Here, activity data refers not only to livestock population data, but also to data on animal characteristics, management and performance that are used to calculate Tier 2 emission factors. In the process set out in L-ADG, the first step is to prepare a spreadsheet to record all available activity data, as a basis for assessing the availability of activity data on specific parameters required by the IPCC Tier 2 livestock model, and the types of inventory category that can be represented using the available data.
The spreadsheet file contains two suggested templates, one for livestock types where there has been no significant change in animal characteristics, management and performance over the inventory period, and one for livestock types where there has been significant change. The spreadsheet is Tool B.1 and can be found in the L-ADG. The template contains some illustrative contents that should be replaced by country-specific data when used. For further guidance on how to make effective use of the tool when compiling Tier 2 livestock GHG inventories, please refer to the main text of the L-ADG.
This spreadsheet complements the Livestock Activity Data Guidance (L-ADG) published by the GRA and CCAFS. L-ADG provides suggestions on how to identify, collect and assess the activity data used to compile Tier 2 livestock GHG inventories for cattle and sheep. Here, activity data refers not only to livestock population data, but also to data on animal characteristics, management and performance that are used to calculate Tier 2 emission factors. In the process set out in L-ADG, once available activity data have been identified, the datasets are assessed against several quality criteria. This assessment can help inventory compilers decide whether to use data from a given source, and to be aware of data quality issues that may affect the quality of the overall inventory. The quality criteria assessed, which have been modified from the IPCC principles for GHG inventory compilation are:
- Transparency: Are data sources and methods transparently described?
- Comparability: Are the definitions and units in the data source in line with the inventory and IPCC requirements?
- Completeness: Does the data source cover all items contained in the indicator?
- Consistency: Are data definitions, collection and analysis methods consistent with those used in other data sources for the same time series in the inventory?
- Accuracy (sampling): Was a representative sampling method applied?
- Accuracy (non-sampling): Were appropriate data collection and analysis methods applied?
- Accessibility: How easy is it to obtain the data in the data source?
- Timeliness: Is the data accessible on a time frame suitable for regular inventory compilation?
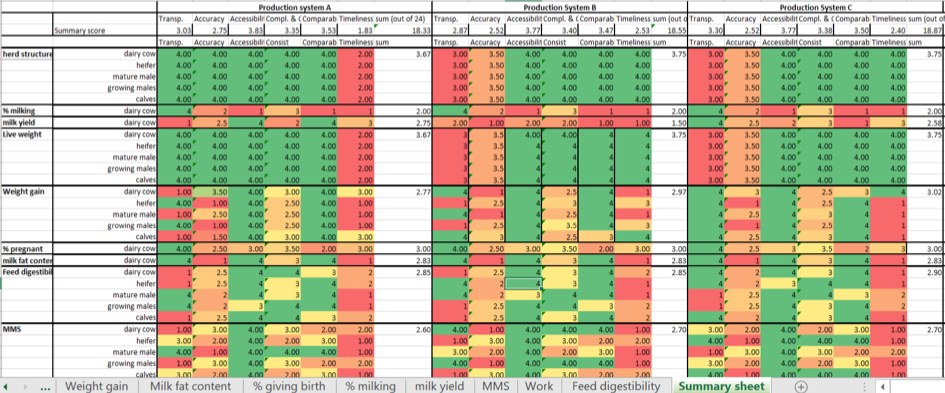
The indicators and scoring criteria are described in the ‘Indicators and scoring’ worksheet in the spreadsheet file. The spreadsheet file contains worksheets for each of the parameters required to estimate Tier 2 livestock GHG emissions, and a summary spreadsheet that visually shows which parameters score higher or lower on each of the quality criteria (see example in the figure below). The spreadsheet is Tool B.16in the L-ADG. The template contains some illustrative contents that should be replaced by country-specific data when used. For further guidance on how to make effective use of the tool when compiling Tier 2 livestock GHG inventories, please refer to the main text of the L-ADG.
Example of visual output from the activity data quality assessment tool
The UNFCCC website houses the annual inventory submissions and includes national inventory reports (NIR) and common reporting format (CRF) of Parties included in Annex I to the Convention. The NIRs give detailed descriptions and numerical information, while the CRF tables contain all greenhouse gas (GHG) emissions and removals, and implied emission factors and activity data. Supplementary information submitted in accordance with the Kyoto Protocol by Parties included in Annex I are included in the submissions of the NIR and CRF.
UNFCCC
2003-present
The American Carbon Registry (ACR) has approved this GHG offset methodology for Grazing Land and Livestock Management (GLLM). This methodology is applicable to beef and dairy production across the globe. It ensures the “complete, consistent, transparent, accurate and conservative quantification of GHG emission reductions associated with a GLLM project”. It focuses on primary GHG sources, sinks and reservoirs (SSRs) impacted by beef and dairy production and provides accounting modules for each of the following components of beef and dairy production: enteric methane, manure methane, nitrous oxide from fertilizer use, fossil fuel emissions, and biotic sequestration in above- and below-ground biomass and soils. Current versions of this methodology are available on the webpage.
Tim Pearson, Nancy Harris, Nicholas Martin, Lauren Nichols, Jonathan Winsten, Jenn Holthaus, and Gustavo Cruz
2014
Winrock International & The American Carbon Registry
The American Carbon Registry (ACR) has approved the use of the Clean Development Mechanism’s Small Scale Methodology: AMS-III.D Methane Recovery in Animal Manure Management Systems. The methodology quantifies emission reductions associated with the introduction of anaerobic digesters on individual dairy farms. Biogas created through the digestion process can either be flared or reused to produce electricity or cooking gas.
This methodology is applicable under the following conditions:
- Manure or the waste streams obtained after treatment are not discharged into natural water resources (e.g. river or estuaries);
- The annual average temperature at the project site is greater than 41°F;
- In the baseline scenario, the retention time of manure waste in the anaerobic treatment system is greater than one month, and if anaerobic lagoons are used in the baseline, their depths are at least 1 meter;
- No methane recovery and destruction by flaring or combustion for beneficial use takes place in the baseline scenario.
Winrock International & The American Carbon Registry
2017