This spreadsheet complements the Livestock Activity Data Guidance (L-ADG) published by the GRA and CCAFS. L-ADG provides suggestions on how to identify, collect and assess the activity data used to compile Tier 2 livestock GHG inventories for cattle and sheep. Here, activity data refers not only to livestock population data, but also to data on animal characteristics, management and performance that are used to calculate Tier 2 emission factors. In the process set out in L-ADG, once available activity data have been identified, the datasets are assessed against several quality criteria. This assessment can help inventory compilers decide whether to use data from a given source, and to be aware of data quality issues that may affect the quality of the overall inventory. The quality criteria assessed, which have been modified from the IPCC principles for GHG inventory compilation are:
- Transparency: Are data sources and methods transparently described?
- Comparability: Are the definitions and units in the data source in line with the inventory and IPCC requirements?
- Completeness: Does the data source cover all items contained in the indicator?
- Consistency: Are data definitions, collection and analysis methods consistent with those used in other data sources for the same time series in the inventory?
- Accuracy (sampling): Was a representative sampling method applied?
- Accuracy (non-sampling): Were appropriate data collection and analysis methods applied?
- Accessibility: How easy is it to obtain the data in the data source?
- Timeliness: Is the data accessible on a time frame suitable for regular inventory compilation?
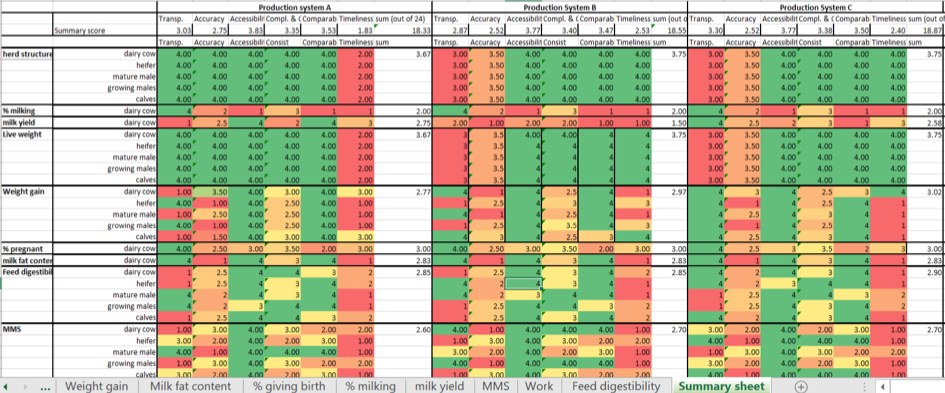
The indicators and scoring criteria are described in the ‘Indicators and scoring’ worksheet in the spreadsheet file. The spreadsheet file contains worksheets for each of the parameters required to estimate Tier 2 livestock GHG emissions, and a summary spreadsheet that visually shows which parameters score higher or lower on each of the quality criteria (see example in the figure below). The spreadsheet is Tool B.16in the L-ADG. The template contains some illustrative contents that should be replaced by country-specific data when used. For further guidance on how to make effective use of the tool when compiling Tier 2 livestock GHG inventories, please refer to the main text of the L-ADG.
Example of visual output from the activity data quality assessment tool