Large-scale Consolidated Methodology: GHG emission reductions from manure management systems

This webpage houses all versions of the ACM0010 GHG emission reductions from manure management systems methodology. This methodology is best suited for large scale projects and is applicable to livestock manure management projects under the following conditions (borrowed from the methodology summary):

(a) Farms where livestock populations, comprising of cattle, buffalo, swine, sheep, goats, and/or poultry, is managed under confined conditions;

(b) Farms where manure is not discharged into natural water resources (e.g. rivers or estuaries);

(c) In the case of anaerobic lagoons treatments systems, the depth of the lagoons used for manure management under the baseline scenario should be at least 1 m;

(d) The annual average ambient temperature at the site where the anaerobic manure treatment facility in the baseline existed is higher than 5°C;

(e) In the baseline case, the minimum retention time of manure waste in the anaerobic treatment system is greater than one month;

(f) The Animal Waste Management Systems (AWMSs) in the project case results in no leakage of manure waste into groundwater.


UNFCCC

2013

Case Study: Inventory practice (Manure management – Japan)

Choice of emission factor for manure management in Japan

This case study is part of a series Inventory Practice that explains data needs, data needed, and methods used to address the data gap. This study examined Finland’s methods of finding a suitable emissions factor for methane manure management emissions.

Case study: Country inventory (The Netherlands)

The Netherlands has a strong history in agriculture. Livestock (dairy, swine and poultry), horticulture and arable farming are still major sub-sectors in the country’s economy. Key categories in the country’s latest inventory include enteric fermentation from dairy cattle, growing cattle and swine. For manure management, methane emissions from cattle, swine and poultry, and N2O emissions from manure management (direct and indirect following atmospheric deposition of NH3 and NOx) are key sources. In the Netherlands, methane emissions from enteric fermentation are primarily caused by cattle (89%), followed by swine (6%) and other livestock categories (sheep, goats and horses, 5%). This case study describes the countries approach for cattle, swine, poultry, horses, sheep and goats.

Case study: Country inventory (Japan)

Total emissions from enteric fermentation was identified as a key category in Japan’s 1990 inventory, and are still a key category in the latest inventory submission (NIR 2018). Nitrous oxide from manure management, but not methane from manure management, is a key category. Japan reports enteric fermentation emissions from dairy and non-dairy cattle using a Tier 2 approach. A Tier 1 approach is used for enteric fermentation from all other livestock types. Methane emissions from manure management are estimated using a Tier 2 approach with a combination of country-specific and default emission factors, depending on the manure management system. Japan’s specific approach adopted for both enteric fermentation and manure management methane emissions has evolved over time. This case study describes the countries approach for cattle, poultry and swine.

Feedipedia – Animal Feed Resources Information System

Feedipedia is an open access information system on animal feed resources that provides information on nature, occurrence, chemical composition, nutritional value and safe use of nearly 1400 worldwide livestock feeds. Additionally, Feedipedia is a world-wide compendium of up-to-date information on feed resources, covering feeds mainly available in tropical, subtropical and Mediterranean regions but also includes common feeds used in temperate countries.


Feedipedia 

2012-2017

INRA CIRAD AFZ and FAO 

Inventory practice: Estimating number of days alive

Keywords: Livestock population | surveys | interpolation | expert judgement

IPCC Guidance suggests that the livestock population data used should be the annual average population:

Annual average population = days_alive * (number of animals produced annually 365)

Many countries do not report in detail how the number of days alive is estimated for cattle, focusing mainly on the gradual growth of cattle populations over time. For beef finishing cattle, swine and poultry, however, estimation of days alive is more common. Countries use various methods to estimate the annual average population and number of days alive. Some examples include:

Modeling different production stages using expert judgement: Canada’s inventory uses cattle subcategory population data from national statistics (e.g. cows, heifers, steers etc). Each sub-category is then divided into production stages (e.g. background heifers and steers, finishing heifers and steers, short- and long-finish feedlot heifers and steers). The proportion of each subcategory backgrounded or on feedlot, and the duration on feedlots until marketing were estimated using expert judgement elicited through a nationwide survey of livestock experts (see Inventory Practice: Structured elicitation of expert judgement in Canada’s initial Tier 2 inventory). The inventory estimates GE and CH4 emissions per subcategory of animal, considering also the number of days spent in each production stage.

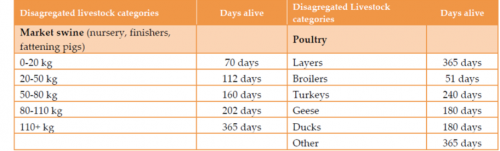
Expert judgement: Croatia’s Tier 2 inventory uses expert judgement from the Faculty of Agriculture at the University of Zagreb estimate the number of days alive for swine and poultry:

Table 1. Livestock categories and days alive estimated to calculate annual average population in Croatia

Source: Croatia NIR 2017

Similarly, South Africa’s inventory uses research that assumed feedlot cattle are kept on the feedlot for 110 days (i.e. assuming 3 cycles per year).

Many countries also adjust emission factors for calves before weaning and consider that enteric fermentation emissions are significant only after weaning. The duration of suckling is mostly determined by expert judgement.


Further Resources

Du Toit CJL, Van Niekerk WA. 2013. Direct methane and nitrous oxide emissions of South African dairy and beef cattle. South African Journal of Animal Science.


Author: Andreas Wilkes, Values for development Ltd (2019)

Livestock inventory practice: Choice of emission factor for manure management in Japan

Keywords: Decision tool | manure management

What data needs were addressed? Choice of emission factor for methane manure management emissions.

Why was the data needed? Japan has a considerable body of data from direct measurements of manure management methane emissions, and early inventories used these measurement results. In order to improve the reliability of the inventory, in NIR 2006 a decision tree was applied to guide the choice of data for emission factors.

Methods used: decision tree

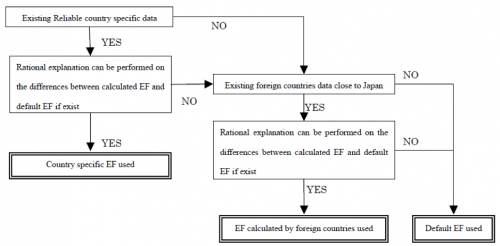
How was the data need addressed? The 2006 IPCC Guidelines note that while using direct measurements of emissions to parameterize models for estimation of emission factors may be a good approach, measurements are difficult to conduct, and require significant resources and expertise, and equipment that may not be available. Direct measurements are not required for good practice as defined by the IPCC. Hence, Tier 1 and Tier 2 approaches are proposed as alternatives. Japan has a considerable body of data from direct measurements. However, not all the measured results were similar to IPCC default values. Therefore, a decision-tree was developed to guide the selection of emission factors (EFs) for manure management emissions (Figure 1).

Figure 1: Decision-tree for guiding the selection of EFs for manure management emissions in Japan.

Source: NIR 2018

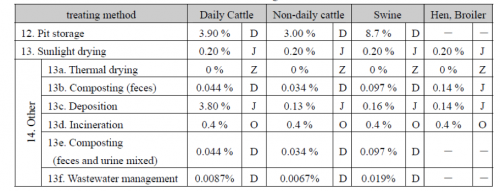
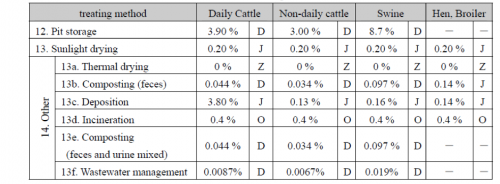
As a result of applying the decision tree, a mixture of IPCC default values, country-specific values and values based on research in other countries is used (Table 1). By continually applying the decision tree to research results newly available in each year, Japan has gradually replaced some EFs with country-specific values, but continues to use default values where better estimates are unavailable.

Table 1: Manure management methane emission factors for cattle, pigs and poultry in Japan’s national inventory

Note: D = IPCC default; J = Japan; O = other countries; Z = not applicable.

Source: NIR 2006


Author: Andreas Wilkes, Values for development Ltd (2019)

Livestock country inventory: The Netherlands

Overview of The Netherlands‘ current Tier 3 and 2 approach

The Netherlands has a strong history in agriculture. Livestock (dairy, swine and poultry), horticulture and arable farming are still major sub-sectors in the country’s economy. Key categories in the country’s latest inventory include enteric fermentation from dairy cattle, growing cattle and swine. For manure management, methane emissions from cattle, swine and poultry, and N2O emissions from manure management (direct and indirect following atmospheric deposition of NH3 and NOx) are key sources. In the Netherlands, methane emissions from enteric fermentation are primarily caused by cattle (89%), followed by swine (6%) and other livestock categories (sheep, goats and horses, 5%).

A country-specific Tier 3 approach is used for enteric fermentation emissions from dairy cattle. A country-specific Tier 2 approach is used for growing and non-dairy cattle, while for all other livestock categories a Tier 1 approach is used and default IPCC emission factors are applied.

Table 1: Tiered approaches used for livestock in the national GHG inventory

Livestock typesTier used for enteric fermentation (CH4)Year adopted*Tier used for manure management (CH4)Year adopted*
Dairy cattleT32006T2Before 2003
Growing cattleT2Before 2003T2Before 2003
Non-dairy cattleT2Before 2003T2Before 2003
PoultryNEBefore 2003T2Before 2003
PigsT1Before 2003T2Before 2003
Other livestock categoriesT1Before 2003T1Before 2003

*Year refers to the year of NIR submission, NE=not estimated

Livestock population data originate from the yearly Agricultural census. The census distinguishes a number of livestock categories (Table 2).

Table 2: Livestock categorization method

Mature dairy cattle2 categories based on region within The Netherlands (Northwest/Southeast)
Mature non-dairy cattle1 category
Growing cattle14 categories based on production purpose (replacement or fattening) and age
Swine6 categories based on age and physiological status
Poultry9 categories differentiated by production purpose (laying hen or broiler) and age
Sheep2 categories: ewes and other
Goats2 categories: milk goats and other
Horses4 categories: horses and ponies for agriculture or private use
Other animalsMules and asses, rabbits (does/meat), minks and foxes

Source: Vonk et al. 2018

Enteric fermentation emissions from cattle

A Tier 3 approach for mature dairy cattle uses a mechanistic, dynamic model representing fermentation mechanisms in the rumen. Rather than assuming rumen CH4 production, the model predicts CH4 production based on the effect of nutrition on microbial activity, volatile fatty acid (VFA) production and hydrogen surplus. By estimating methane production directly, the model clearly differentiates from other model approaches and calculation methods, and from the Tier 2 approach which uses a fixed methane conversion factor (Figure 1).

The model calculates (i) gross energy (GE) intake, (ii) CH4 EF (in kg CH4/cow/year) and (iii) the methane conversion factor (Ym; % of GE intake converted into CH4) on the basis of data on:

  • The share of feed components (grass silage, maize silage, wet by-products and concentrates);
  • the chemical composition of feed components (soluble carbohydrates (including sugars), starch, cell walls (hemi-cellulose, cellulose and lignin), crude protein, crude fat and crude ash);
  • rumen intrinsic degradation characteristics of starch, crude protein and fibre.

Due to differences in rations between the Northwest (rations mainly grass-based) and Southeast of the country (large share of maize silage) calculations for these regions are made separately.

Figure 1. Schematic representation of the difference between Tier 2 and Tier 3 approaches (MCF = Methane Conversion Factor, MEF = Methane Emission Factor)
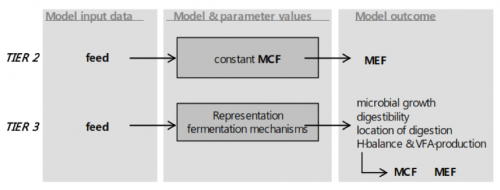
Source: Bannink 2011

For other mature cattle and growing cattle categories, enteric fermentation emissions are calculated by multiplying the gross energy intake with a methane conversion factor (Ym). As the production of white veal calves is an important sub-sector in The Netherlands, and considering the large share of milk products in their ration, in this case a country-specific Ym value is used. For all other cattle types (young cattle and mature non-dairy cattle) the IPCC 2006 default Ym is used.

Gross energy intake is based on rations calculated by the Working Group on Uniformity of calculations of Manure and Mineral data (in Dutch ‘Werkgroep Uniformering berekening Mest- en mineralencijfers’, WUM). Changes in GE intake are based on changes in both the total feed intake and the share of feed components.

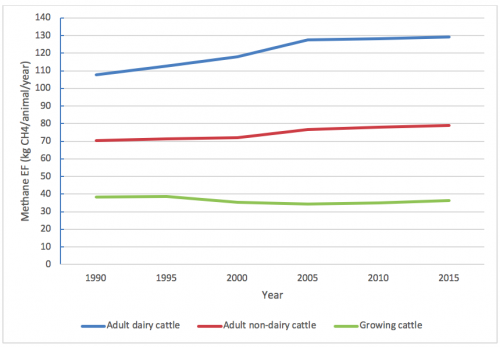
Since 1990, there have been continuous increases in feed intake (20%), level of milk production (34%) and CH4 emission (17%), resulting in a continued reduction of CH4 per kg of fat- and protein-corrected milk (13%) (Bannink 2011). An increase in total feed intake has increased the emission factor over time, however a change in nutrient composition, contributing to (among others) feed digestibility has partly offset the increase in emission factor. An overview of emission factors for methane emissions from enteric fermentation is provided in Figure 2.

Figure 2. Methane emission factors for cattle (1990-2015)
Source: Netherlands NIR 2017

Inventory compilation

The following data is collected:

  • the number of dairy cows;
  • registered national milk production;
  • a weighed yearly average of feed intake;
  • a weighed yearly average of diet composition;
  • data on feed analysis and chemical composition of forages, and the composition of concentrates feeds.

Data on nutrition and dairy performance are delivered by the Working Group on Uniformity of calculations of Manure and Mineral data (WUM) on a yearly basis. Data is collected and aggregated by a team under the coordination of Statistics Netherlands (CBS).

Data on the chemical composition of roughages (grass herbage, grass silage, maize silage) are provided by Eurofins Agro, the main commercial laboratory for such in The Netherlands. The chemical composition of roughages from many farms is analysed as part of the Dutch manure policy; farmers in The Netherlands are obliged to demonstrate the mineral management on their farm, including the composition of their roughages (through fixed amounts or by analysis).

Data on the type, amount and chemical composition of by-products and concentrates fed to dairy cattle are collected by CBS by consultation with the feed industry and use of feed tables.

How the approach has developed over time: from Tier 2 to Tier 3 (2006)

The Netherlands began using a country-specific Tier 3 approach for dairy cattle in 2006 to be able to justify a lower CH4 conversion factor than the average default value with the relatively high nutritional quality of Dutch dairy diets. At that time, the IPCC guidelines for a Tier 2 approach applied a default CH4 conversion factor of 6.5% of gross energy (GE) intake. This value appeared relatively high for Dutch conditions. Furthermore, using a constant conversion factor did not reflect variation in level of feed intake, feed digestibility and the composition and quality of the ration. A dynamic, mechanistic model to account for this variation was available already (Mills et al., 2001) and was adapted with an improved representation of the production of volatile fatty acids (Bannink et al. 2000; 2006); a crucial element for prediction of hydrogen balance and CH4 formation. Therefore, the Netherlands revised its method in 2005 by using this dynamic, mechanistic model as a country-specific Tier 3 approach from 2006 onwards.

The model is derived from the rumen fermentation model developed by Dijkstra et al. (1992) and extensively evaluated by Neal et al. (1992) and Bannink et al. (1997). The model, initially developed to model the fermentation process in the rumen, appeared to be suitable for methane modeling as well, and offered the opportunity to take more detailed ration composition and quality into account. The model thus enabled more precise methane emission estimations; each aspect of the model is based on scientific research. Evaluation studies by Neal et al. (1992) and Bannink et al. (1997) indicated the need to revise the representation of the amount and type of VFA as end-product of rumen fermentation. Subsequently, a database of in vivo data from lactating cows was developed and analyzed by Bannink et al. (2000; 2006). Mills et al. (2001) adapted the model by adding coefficients for digestion in the small intestine and a mechanistic, adding a dynamic, mechanistic module for microbial activity in the large intestine, and adding calculation of hydrogen balance in rumen and large intestine and CH4 formation. An updated version with a representation of VFA formation that is dependent on digesta acidity, applied as a Tier 3 approach was described by Bannink et al. (2011).

Revised feed intake, milk production and ration composition data for the years 1990 until 2007 (2009)

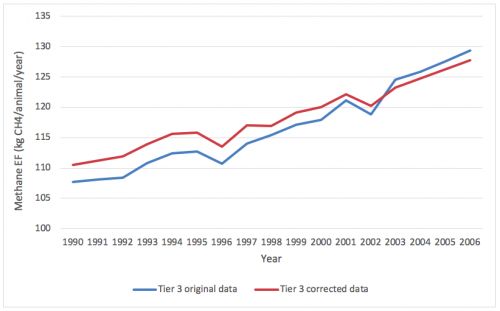
In 2009 revisions were made to derive input data on feed intake, ration composition and milk production figures from 1990 until 2007. Revisions included (i) inclusion of feed losses (of roughages, concentrates and by-products), (ii) an increase of the net energy requirement for maintenance and (iii) a correction for the ammonia-N fraction of N in crude protein (Bannink, 2011). Calculations of the methane emissions from enteric fermentation from dairy cows were subsequently revised. Results of the corrections are displayed in Figure 3.

In 2016, a slight modification was introduced to let the model apparent fecal N digestibility and excretion urine or ammoniacal N more accurately. This modification had negligible effects on predicted CH4 emissions however (a 0.03% higher CH4 emission factor; results not shown).

Figure 3. Recalculated methane EF for dairy cattle with revised input data
Source: adapted from Bannink 2011

Methane emissions from manure management

Manure management methane emissions from cattle, swine and poultry are a key category in the national inventory (NIR) and calculated using a country-specific Tier 2 approach. Methane emissions from manure are mainly caused by fermentation of organic matter in an anaerobic environment. As methanogenic bacteria take some time to produce methane, methane from manure stored for less than a month is very low. The conversion of organic matter in methane also depends on manure composition and environmental factors such as temperature. Methane emissions are calculated for liquid and solid manure management systems and, where applicable, also for manure produced on pasture land whilst grazing.

Manure management methane emission estimates are directly related to calculations done for methane emissions from enteric fermentation, as key input data consist of the amount of volatile solids (VS) produced per animal, which are again based on feed intake, composition and VS digestibility. The amount of volatile solids excreted by livestock depends on the digestibility of the organic matter and protein content of the feed. Data on feedstuffs and rations are used to provide this information (Zom & Groenestein, 2015).

Manure management methane emissions are calculated by multiplying the volatile solids excretion (VS, in kg) with the maximum methane production potential (BO, in m3 CH4/kg VS) and the methane conversion factor, which is based on the manure management conditions.
For all other livestock categories emissions are estimated using a Tier 1 approach (Vonk et al. 2018).

Uncertainty management

The uncertainty for each aspect of the rumen fermentation model used to calculate methane emissions from enteric fermentation, is estimated by experts. Since revisions to derive input data were done in 2009, and calculations were corrected in 2011, the estimated uncertainty for annual emissions from dairy cattle was corrected from 20 to 16%.

Until 2017, a 5% uncertainty level for livestock population data was used, while for the emission factor an uncertainty level of 15% was employed (combining to 16% overall uncertainty).
In the recently published update of the methodology for estimating emissions from agriculture in The Netherlands, a revised uncertainty level for mature dairy cattle of 15% is described, based on a new estimate of uncertainty of 2% for the total animal population. Furthermore, uncertainty levels are disaggregated for the Northwest and Southeast of The Netherlands, with an uncertainty of 21% for the split emission factor, and 3.4 and 2.4% for the activity data, respectively.

For other mature cattle, growing cattle, swine and other livestock categories, uncertainty levels are 21, 11, 41 and 44.5% respectively (Vonk et al. 2018).


Further Resources

Bannink A. 2011. Methane emissions from enteric fermentation by dairy cows, 1990-2008; Background document on the calculation method and uncertainty analysis for the Dutch National Inventory Report on Greenhouse Gas Emissions. Wageningen, Statutory Research Tasks Unit for Nature and the Environment.

Bannink A, van Schijndel MW, Dijkstra J. 2011. A Model of Enteric Fermentation in Dairy Cows to Estimate Methane Emission for the Dutch National Inventory Report Using the IPCC Tier 3 Approach. Animal Feed Science and Technology.

Bannink A, De Visser H, Van Vuuren AM. 1997. Comparison and evaluation of mechanistic rumen models. British Journal of Nutrition.

Dijkstra J, Neal HD StC, Beever DE, France J. 1992. Simulation of nutrient digestion, absorption and outflow in the rumen: model description. Journal of Nutrition.

Mills JAN, Dijkstra J, Bannink A, Cammell SB, Kebreab E, France J. 2001. A mechanistic model of whole-tract digestion and methanogenesis in the lactating dairy cow: model development, evaluation, and application. Journal of Animal Science.

Neal HD StC, Dijkstra J, Gill M. 1992. Simulation of nutrient digestion, absorption and outflow in the rumen: model evaluation. Journal of Nutrition.

NIR. 2017. Greenhouse gas emissions in The Netherlands 1990 2015 National Inventory Report 2017. RIVM Report 2017-0033.

Vonk J,  et al. 2018. Methodology for estimating emissions from agriculture in the Netherlands update 2018. Calculations of CH4, NH3, N2O, NOx, PM10, PM2.5 and CO2 with the National Emission Model for Agriculture (NEMA). Wageningen, The Statutory Research Tasks Unit for Nature and the Environment (WOT Natuur & Milieu). WOt-technical report.

Zom RLG and Groenestein CM. 2015. Excretion of volatile solids by livestock to calculate methane production from manure. TC-O_20. In: RAMIRAN 2015 16th International Conference Rural-Urban Symbiosis. Proceedings Book. 8th 10th September 2015, Hamburg University of Technology, Germany.


Author: Andreas Wilkes, Values for development Ltd (2019)

Livestock country inventory: Japan

Overview of Japan’s current Tier 2 approach

Total emissions from enteric fermentation was identified as a key category in Japan’s 1990 inventory, and are still a key category in the latest inventory submission (NIR 2018). Nitrous oxide from manure management, but not methane from manure management, is a key category. Japan reports enteric fermentation emissions from dairy and non-dairy cattle using a Tier 2 approach. A Tier 1 approach is used for enteric fermentation from all other livestock types. Methane emissions from manure management are estimated using a Tier 2 approach with a combination of country-specific and default emission factors, depending on the manure management system. Japan’s specific approach adopted for both enteric fermentation and manure management methane emissions has evolved over time.

Table 1: Overview of Tiers used for livestock methane emissions in Japan’s national GHG inventories

Livestock typesTier used for enteric fermentation (CH4)Year adoptedTier used for manure management (CH4)Year adopted
Dairy cowsT2mid-1990sT1/T21990s
Non-dairy cowsT2mid-1990sT1/T21990s
PigsCS T1*early 1990sT1/T21990s
BuffaloT1-T1-
SheepT1-T1-
GoatsT1-T1-
HorsesT1-T1-

*Tier 1 approach with country-specific emission factor.

Enteric fermentation

Approach used: Country-specific model.

Why was this approach adopted? Following the IPCC Guidelines, Japan adopted a Tier 2 approach, but decided to follow the common practices in Japanese livestock research of estimating emission factors on the basis of dry matter intake.

Description of approach: Japan’s country-specific model is based on a relationship between emissions and dry matter intake (DMI). The approach has evolved over time through changes in livestock categorization and methods used to estimate DMI of different cattle sub-categories.
Research published in the early 1990s (Shibata et al. 1993) showed that for ruminants the volume of methane emitted per head per day could be related to dry matter intake using the equation:

Y = -17.766 + 42.793X 0.489X2

where Y is the volume of methane generated (liters/day) and X is dry matter intake (kg/day). Japan’s inventory continues to use this equation.

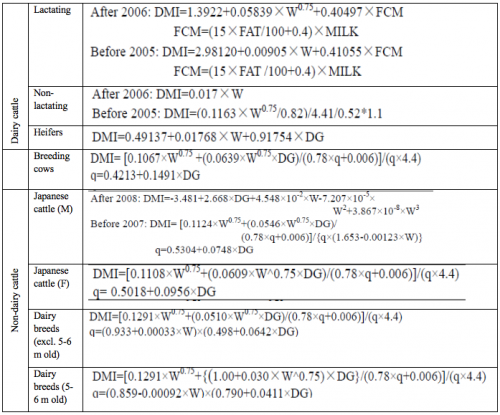
Emission factors for each type of animal are estimated using average dry matter intake as recorded in the Japan Feed Standards, which is compiled by the Japan Livestock Industry Association. In the feed standards, DMI is estimated using an equation based on fat corrected milk yield, body weight, and daily weight gain by daily growth, where fat corrected milk is updated on the basis of annual official statistics. In 2006 and 2008, the equations used to estimate DMI of different sub-categories were updated for dairy and non-dairy cattle, respectively (Table 2).

Table 2: Equations used to estimate DMI by cattle in Japan

W: weight, FCM: fat corrected milk, FAT: fat content of milk, MILK: Milk yield, DG: daily growth, q: energy metabolic rate.
Source: NIR 2012

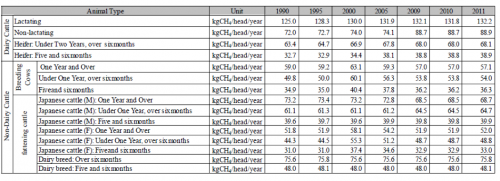
Livestock population numbers for each type of cattle come from official statistics documented in a survey at 1 February each year by the Ministry of Agriculture, Forestry and Fisheries. Initially, inventory sub-categories included 3 types of dairy cattle (lactating, dry and heifers) and 4 types of non-dairy cattle (breeding cows, fattening cattle <1 year and >1 year old, and dairy breeding animals). The inventory excluded cattle under 6 months old, which were assumed to account for 50% of the population of cattle categories under 1 year old. Subsequently, 5 and 6 month old cattle were identified as a separate sub-category, and fattening cattle were divided into male and female sub-groups of different ages and sub-groups defined by breed (NIR 2006). An inventory review in 2016 pointed out that cattle over 3 months old emit methane, and in NIR 2017, calves between 3 and 6 months were added as another sub-category.

Table 3: Emission factors for cattle in Japan’s national inventory

Source: NIR 2012

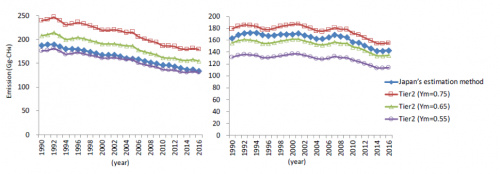
Japan has undertaken studies to compare the results of estimation using its country-specific approach and the IPCC model. Using available national data and IPCC default values for Ym, Cfi and Cpregnancy, enteric fermentation emissions were estimated using the IPCC model. The results show that there are no significant differences between the estimates made using the two approaches (Figure 1).

Figure 1: Comparison of results of Japan’s country-specific estimation method and IPCC Tier 2 method for dairy cattle (left) and non-dairy cattle (right)

Source: NIR 2018.

Manure management (Methane)

In its early inventories, manure management methane emissions from cattle, pigs and poultry were estimated using measurements conducted on different manure management systems in Japan (JLTA 1999; JLTA 2002; Fukumoto et al. 2001). Subsequently, a mixed approach was adopted whereby national emission factors were used if there was reliable data, and IPCC default values were used if appropriate EFs from other countries were not available (see Inventory Practice: Choice of emission factors in Japan). EFs established using Japanese research are based on direct measurements, and the use of country-specific values has increased over time. For example, NIR 2018 uses country-specific values for the methane EFs from pit storage and biogas digesters. This was based on actual measurements in 9 regions of the country using the floating chamber method (MAFF 2012). The integrated EF for the country is the average of regional EFs weighted by the dairy cattle population in the country (NIR 2018).

Table 4: Manure methane emission factors for cattle, pigs and poultry in Japan’s inventory

Note: D = IPCC default; J = Japan; O = other countries; Z = not applicable.
Source: NIR 2006

Data on the proportion of animal waste managed in different systems derived from different sources. In 1997, a survey was conducted prior to enforcement of the “Act on the Appropriate Treatment and Promotion of Utilization of Livestock Manure”. This act prohibits inappropriate manure management practices and induced changes in the proportion of manure managed in different systems. A second survey was conducted in 2009, and data for years between 1997 and 2009 were interpolated. From 2009 onwards, results of an annual national survey conducted by MAFF have been used.

Uncertainty management

For cattle, the uncertainties of emission factors were calculated by finding the 95% confidence interval in accordance with the equation used to estimate the emission factors (Dairy cattle: -26% to +32%, non-dairy cattle: -40% to +49%). Populations of cattle (activity data) are based on data from the official Livestock Statistics, but standard error for cattle is not described in the official statistics. Therefore, the uncertainties for activity data were substituted by 1% error estimated for swine in the Livestock Statistics. As a result, the uncertainties of the emissions were determined to be -26% to +32% for dairy cattle and -40% to +49% for non-dairy cattle.

The uncertainties for emission factors of livestock other than swine were applied the 50% default data given in the 2006 IPCC Guidelines. For the uncertainty for activity data of swine, 1% of standard error for swine given in the official Livestock Statistics is applied. For activity data for livestock other than swine, uncertainty was substituted by the value for broilers (9%) described in the Livestock Statistics. As a result, the uncertainties of the emissions were determined to be -72% to +157% for swine and 51% for buffalo, sheep and goats and horses.


Further Resources

Y. Fukumoto, et al. 2001. Measurement of NH3, N2O and CH4 emissions from swine manure composting using a new dynamic chamber system, Proceedings of 1st IWA International Conference on Odor and VOCs Measurement, Regulation and Control techniques. Australia pp 613-620.

Japan Livestock Technology Association, GHGs emissions control in livestock Summary, March 2002

Japan Livestock Technology Association, GHGs emissions control in livestock Part4, March 1999

Ministry of Agriculture, Forestry and Fisheries of Japan, the Project on Survey and Investigation for Elaboration of GHG Emissions from Agriculture, Forest and Fisheries Sector, within the Project on Development for Method of Promotion for Countermeasures of Global Environment in the Agriculture, Forest and Fisheries Sector in FY2011, 2012.

Shibata, Terada, Kurihara, Nishida, Iwasaki. 1993. Estimation of Methane Production in Ruminants. Animal Sciences and Technology.


Author: Andreas Wilkes, Values for development Ltd (2019)