

Keywords: Livestock characterization
What data needs were addressed? Categorizing livestock to reflect both differences in production systems in the country and data availability.
Why was the data needed? Beef production is a major part of Uruguay’s economy, an important source of export earnings, and the source of about 40% of total national GHG emissions. Uruguay’s NDC has set a domestic target of reducing GHG emissions per kilo of beef by 33% in 2030 compared to 1990 levels. A Tier 2 approach is essential for tracking change in emissions and emission intensity. The 2004 national inventory had divided the country into four regions based on administrative territories. A review of the inventory identified the need to adopt a Tier 2 approach, for which an appropriate characterization of livestock was needed.
Methods used: Livestock characterization.
How was the data gap addressed? When the Climate Change Unit of the Ministry of Housing, Territorial Planning and Environment first began to develop a Tier 2 approach, a group of experts was convened to develop an improved regional characterization of livestock and livestock sub-categories. The working group of experts consisted of representatives from the Climate Change Unit, the Ministry of Livestock, Agriculture and Fisheries, agricultural research institutes and universities, industry bodies and private sector experts.
Based on national research on agro-ecological zones, the country was divided into 7 zones, defined by soil types, the type and quality of the pastures, and the dominant production systems. The cattle population was divided into 9 sub-categories: bulls, breeding cows, wintering cows, bulls >3 years old, steers 2-3 years, bulls 1-2 years, heifers >2 years, heifers 1-2 years old, and calves. Within each of the 7 zones, data on the livestock population was obtained at the administrative level of Police Sections, an administrative division, on average 7000 hectares in size, that is the spatial basis for collection of agricultural statistics. Information on the production and feeding systems, and animal performance was obtained for each of the 7 zones from national publications or expert judgement from the group of experts.
Figure 1: Division of Uruguay’s national territory by agro-ecological zone (left panel) and by combination of agroecological zone and administrative regions (right panel)
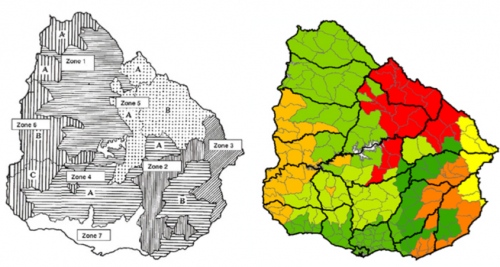
Source: Uruguay BUR1
Resources
GRA and CCAFS (n.d.) Livestock development and climate change: the benefits of advanced greenhouse gas inventories.
Author: Andreas Wilkes, Values for development Ltd (2019)